 Training
Chapter 1 of 7 · Getting oriented

How to use Return on Intelligence
A narrated tour of the Return on Intelligence dashboard, from the headline return to the roadmap. 22 steps in 7 chapters · about 3:32.

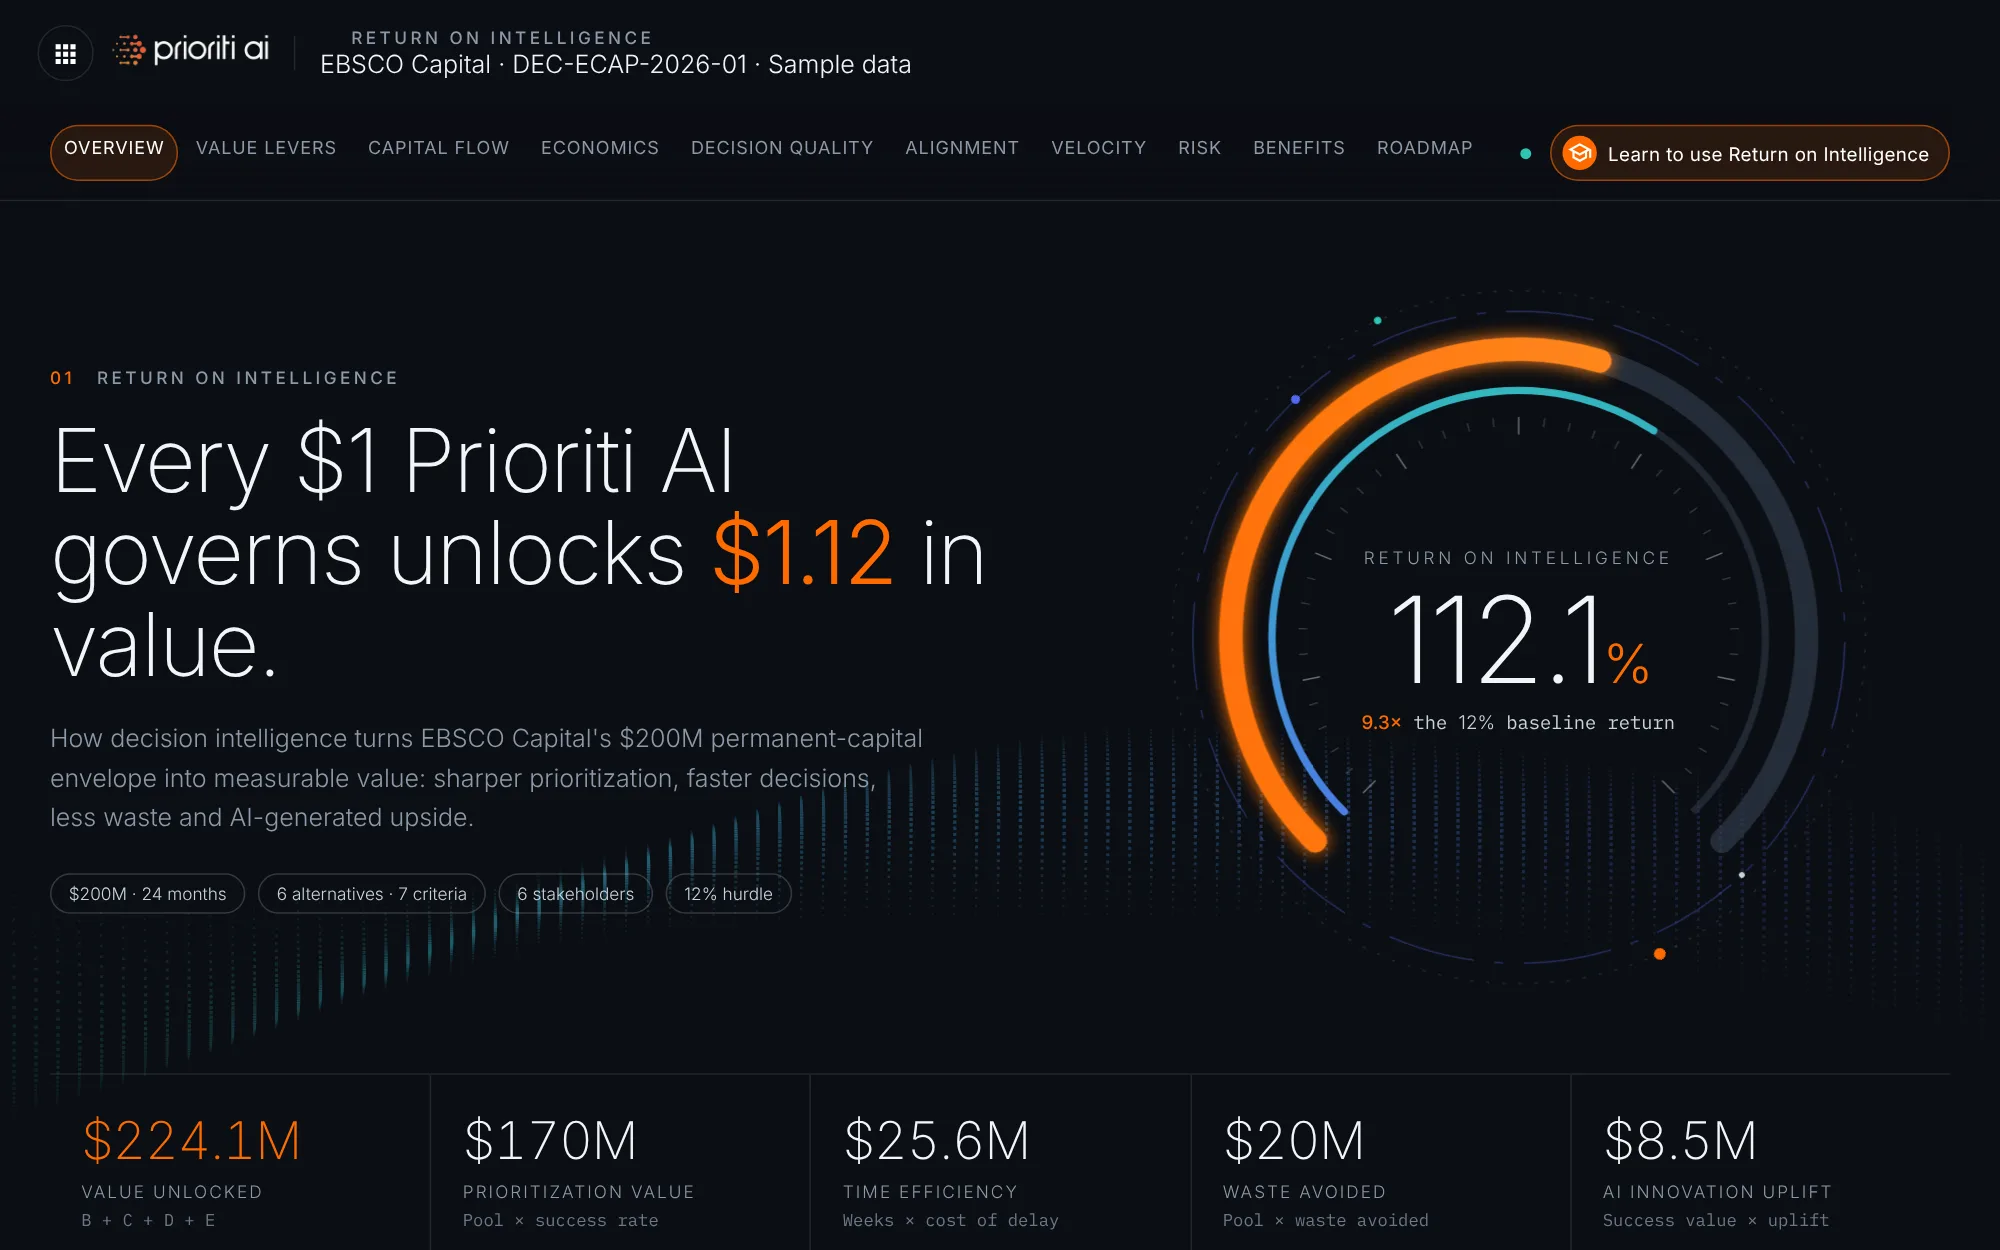
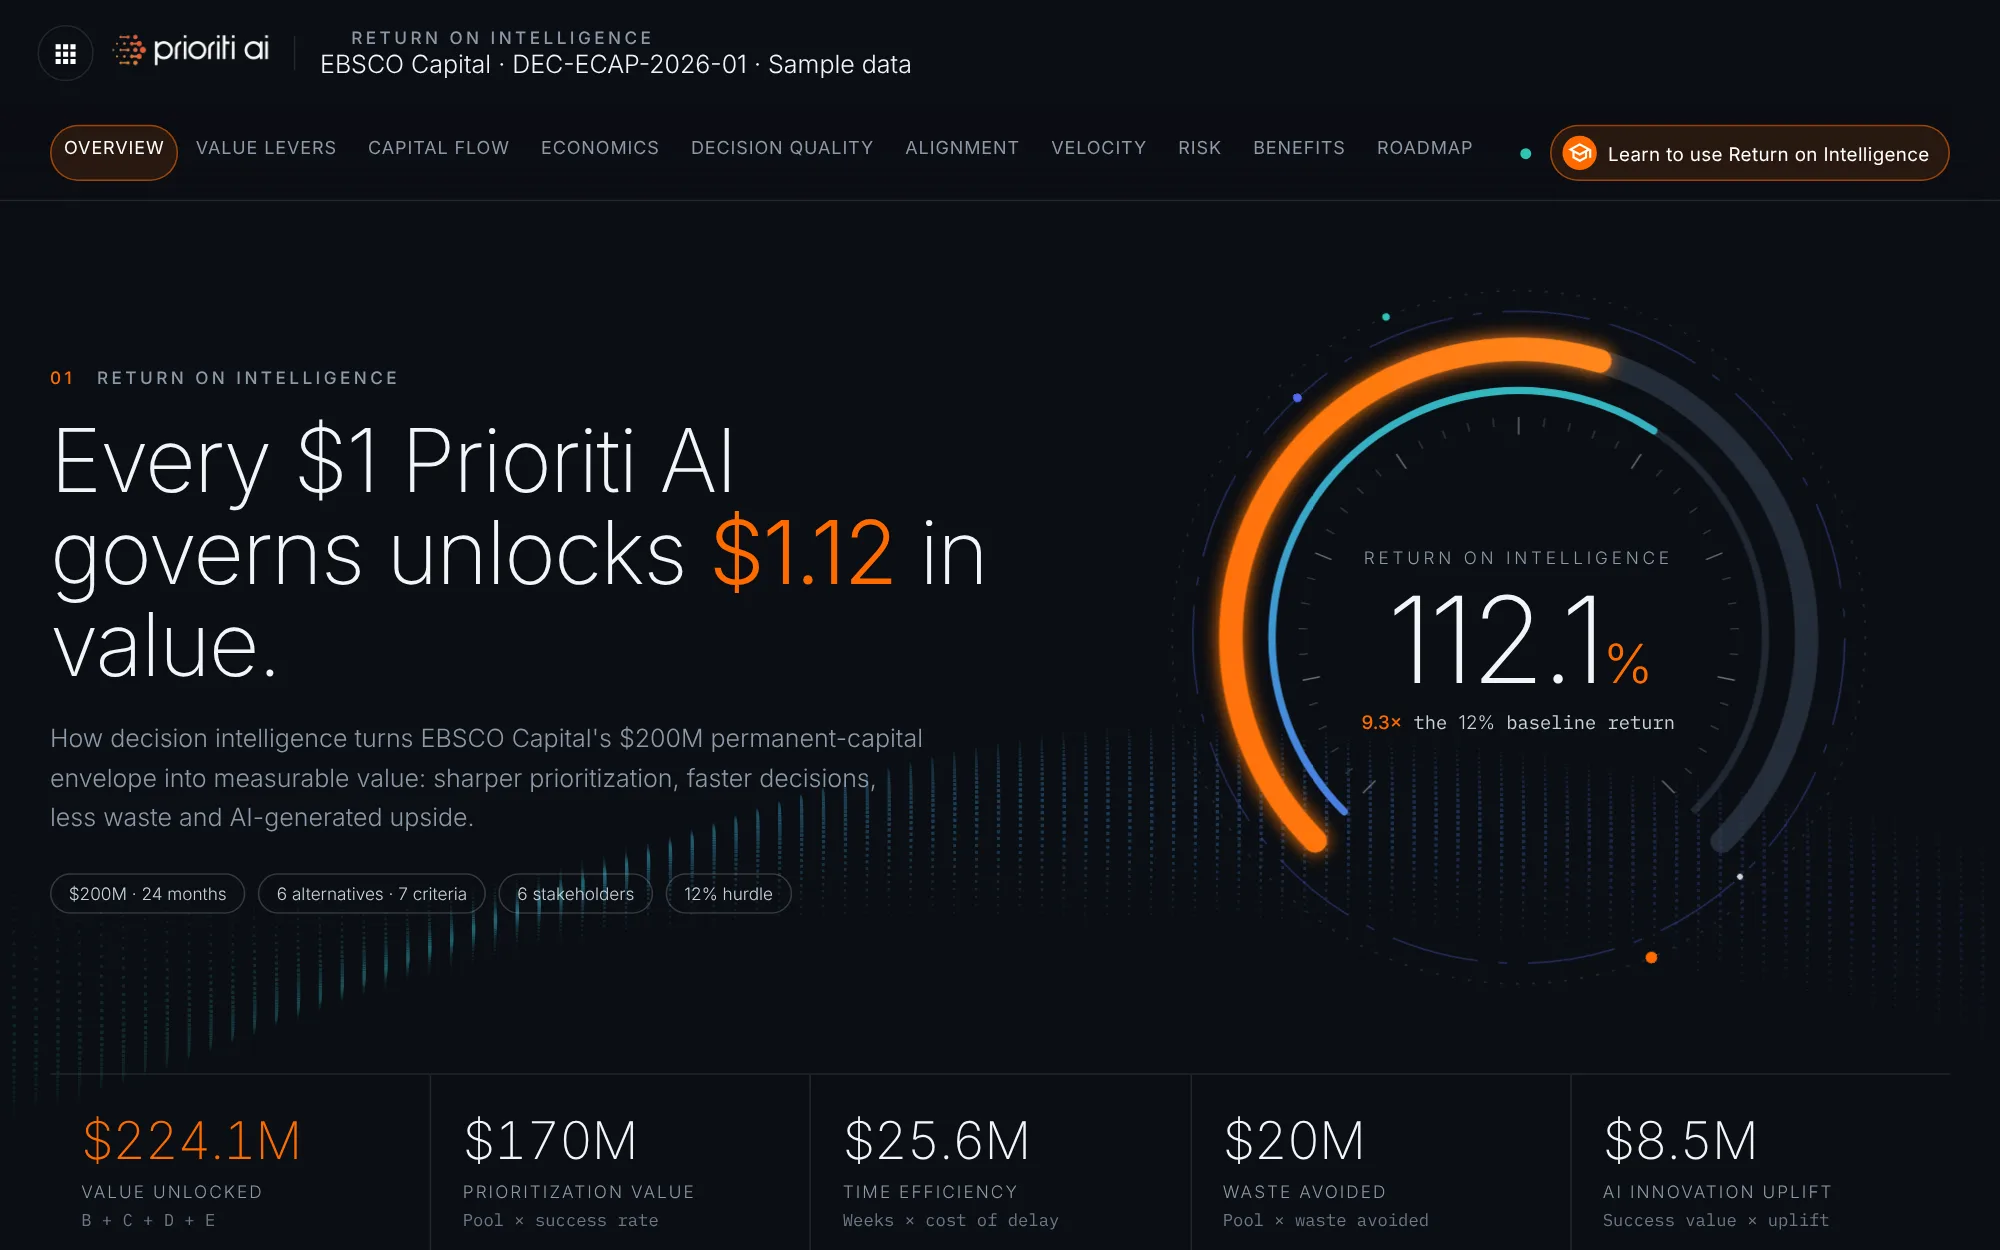
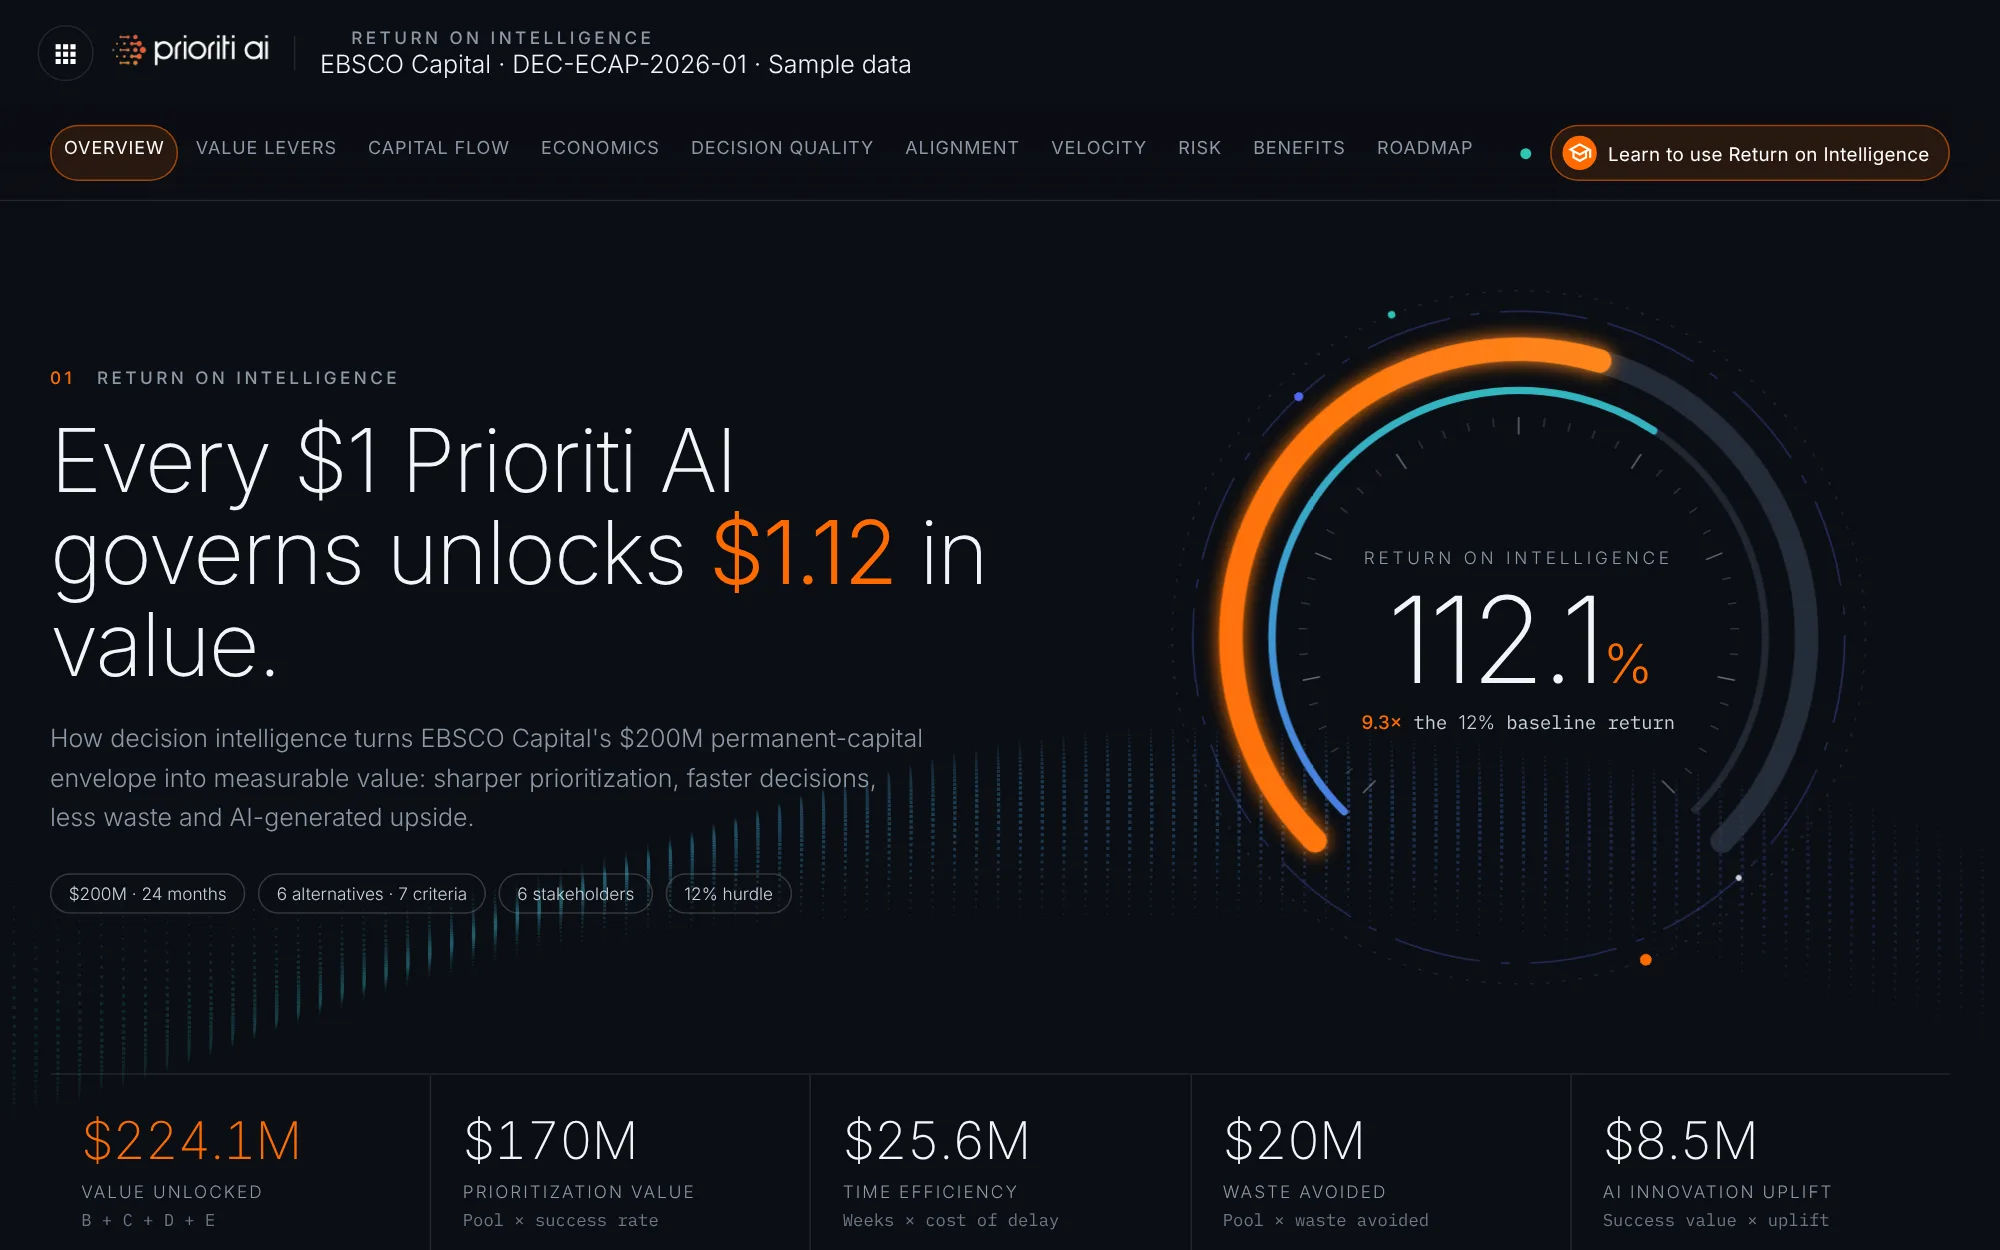
Welcome to Return on Intelligence. In about three minutes, you'll see how Prioriti AI turns a $200 million envelope into measurable value. All figures are sample data.
The gauge shows the return on intelligence: 112%. The inner ring compares it with the 12% baseline return, a 9.3 times lift.
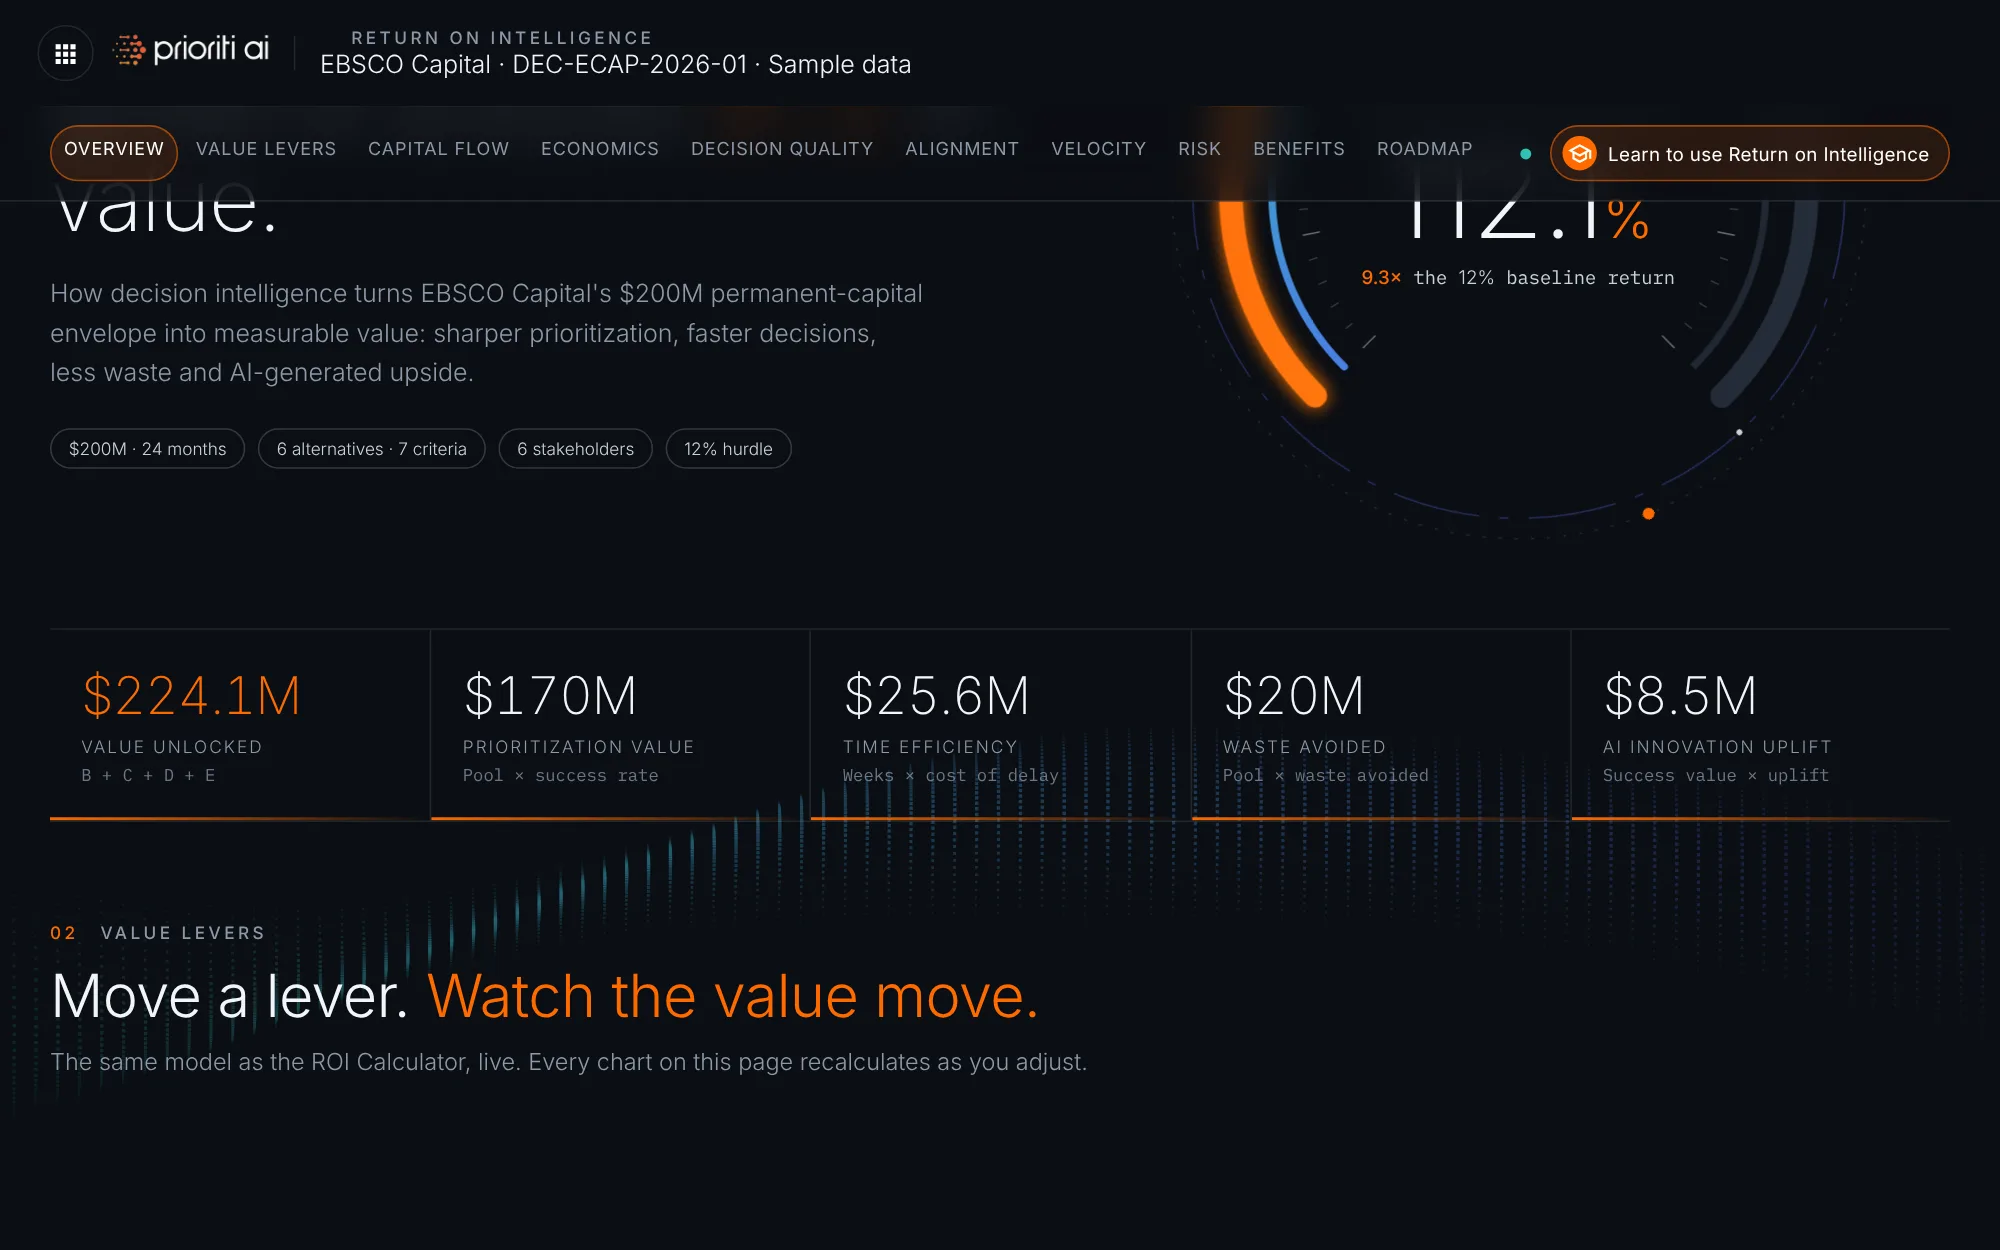
Five stats break it down: $224 million of value unlocked, from better prioritization, time saved, waste avoided, and AI uplift.
The menu jumps to any of ten views and follows you as you scroll. The Learn button on the right opens this tour.
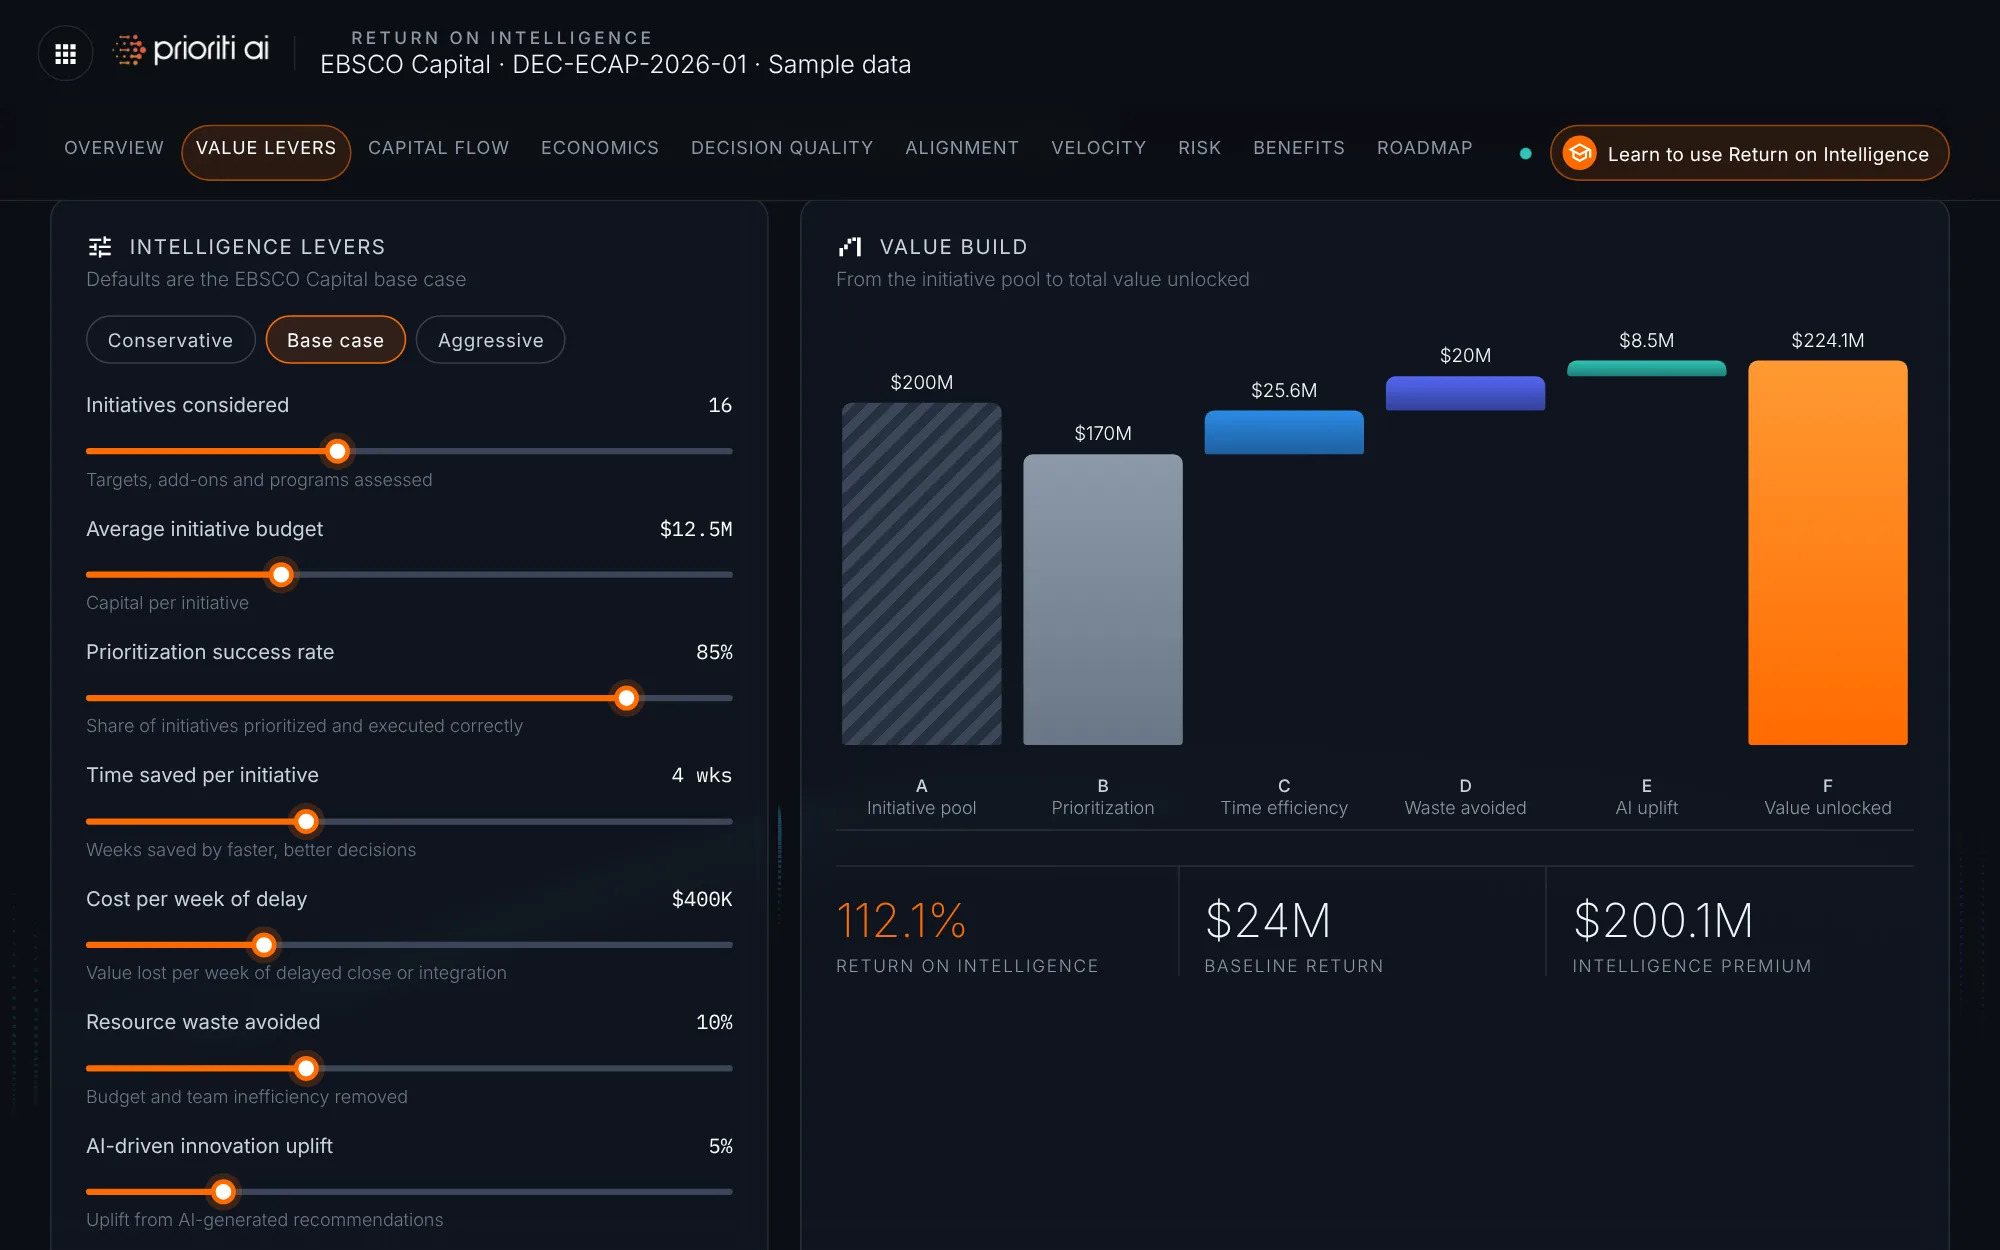
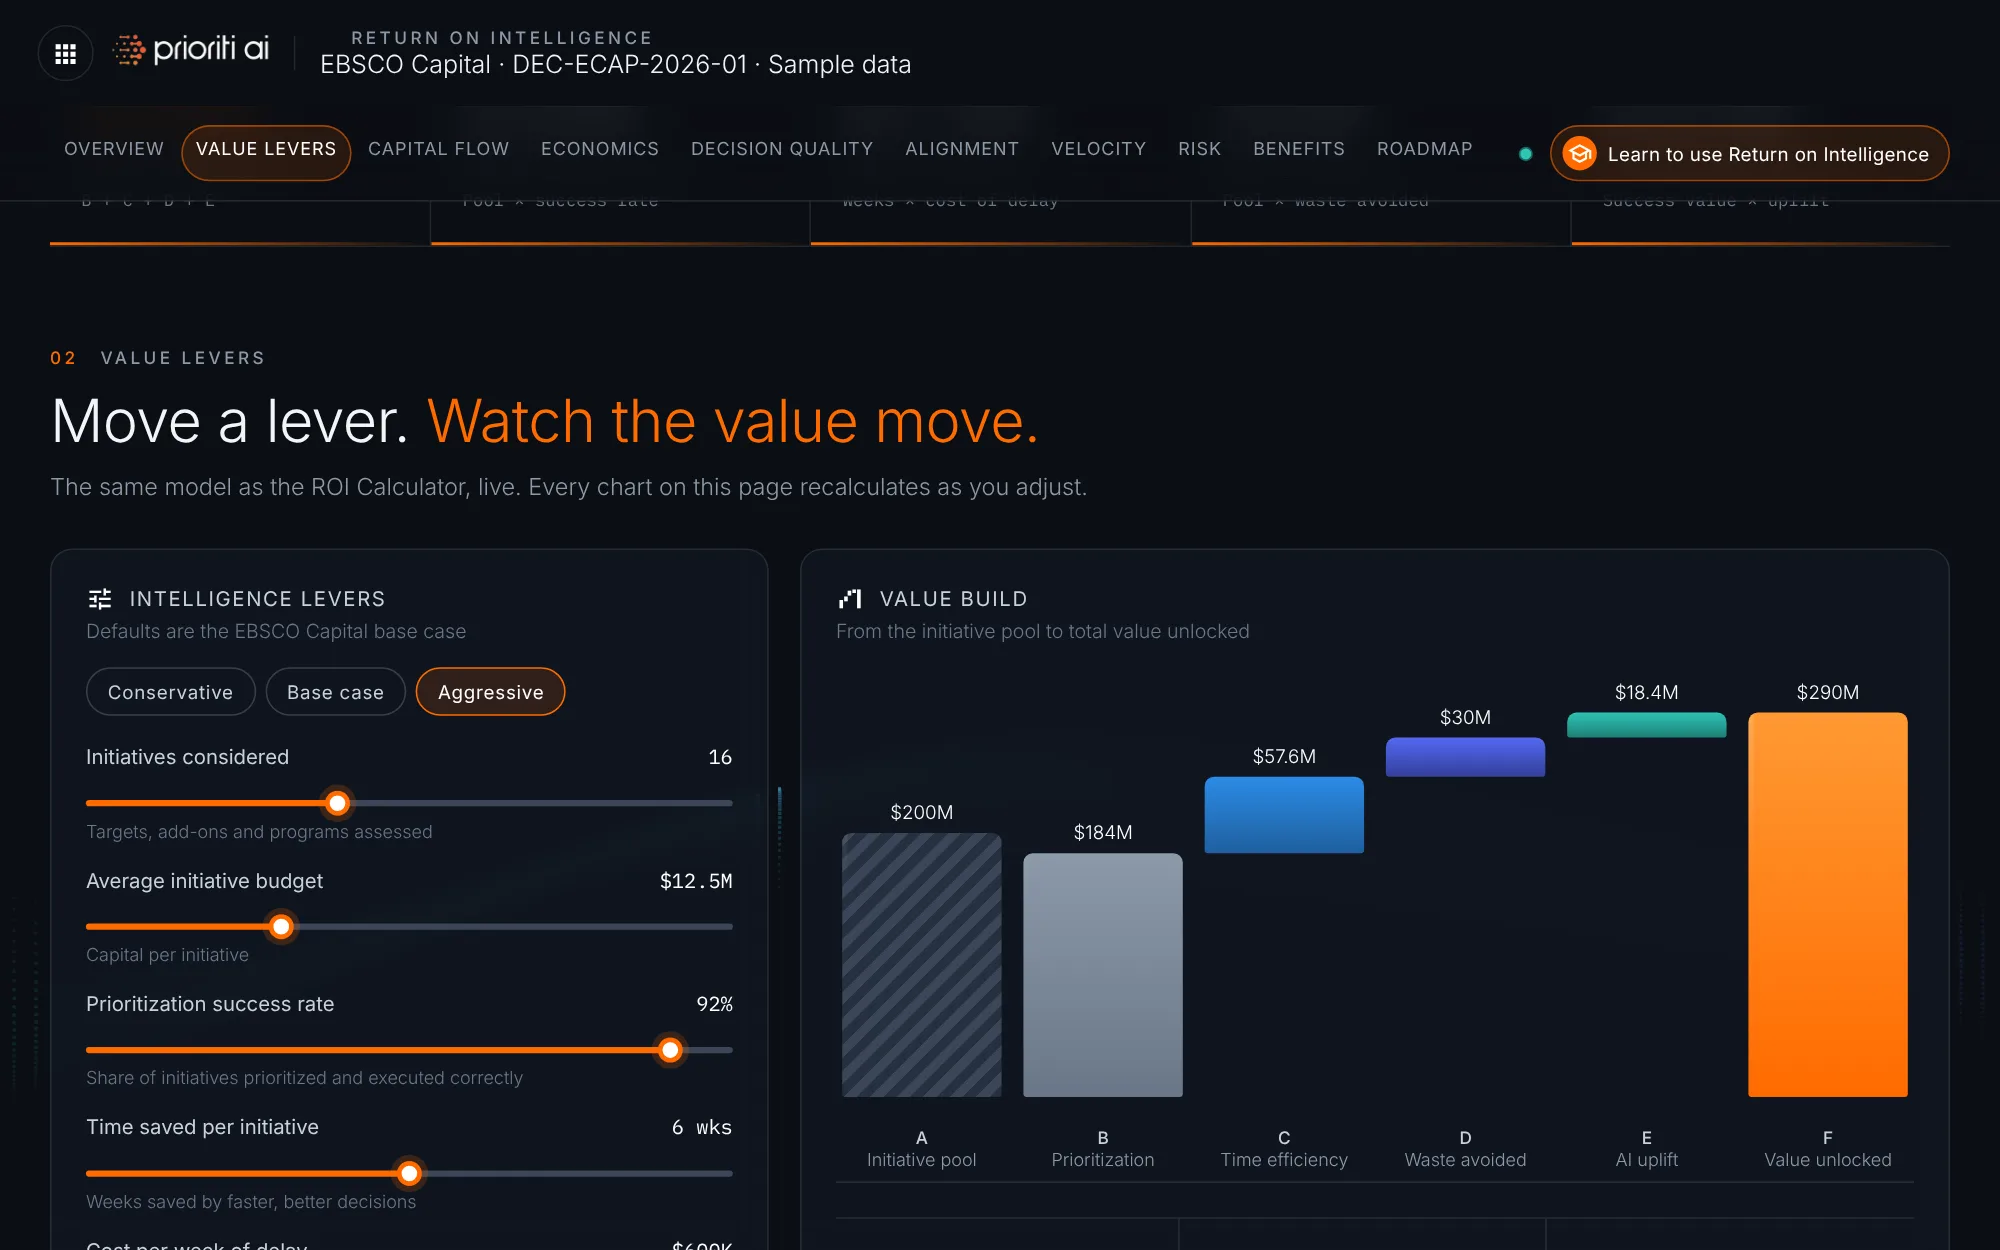
Eight levers drive the model. They use the same formula as the ROI Calculator, starting from the Initech Capital base case.
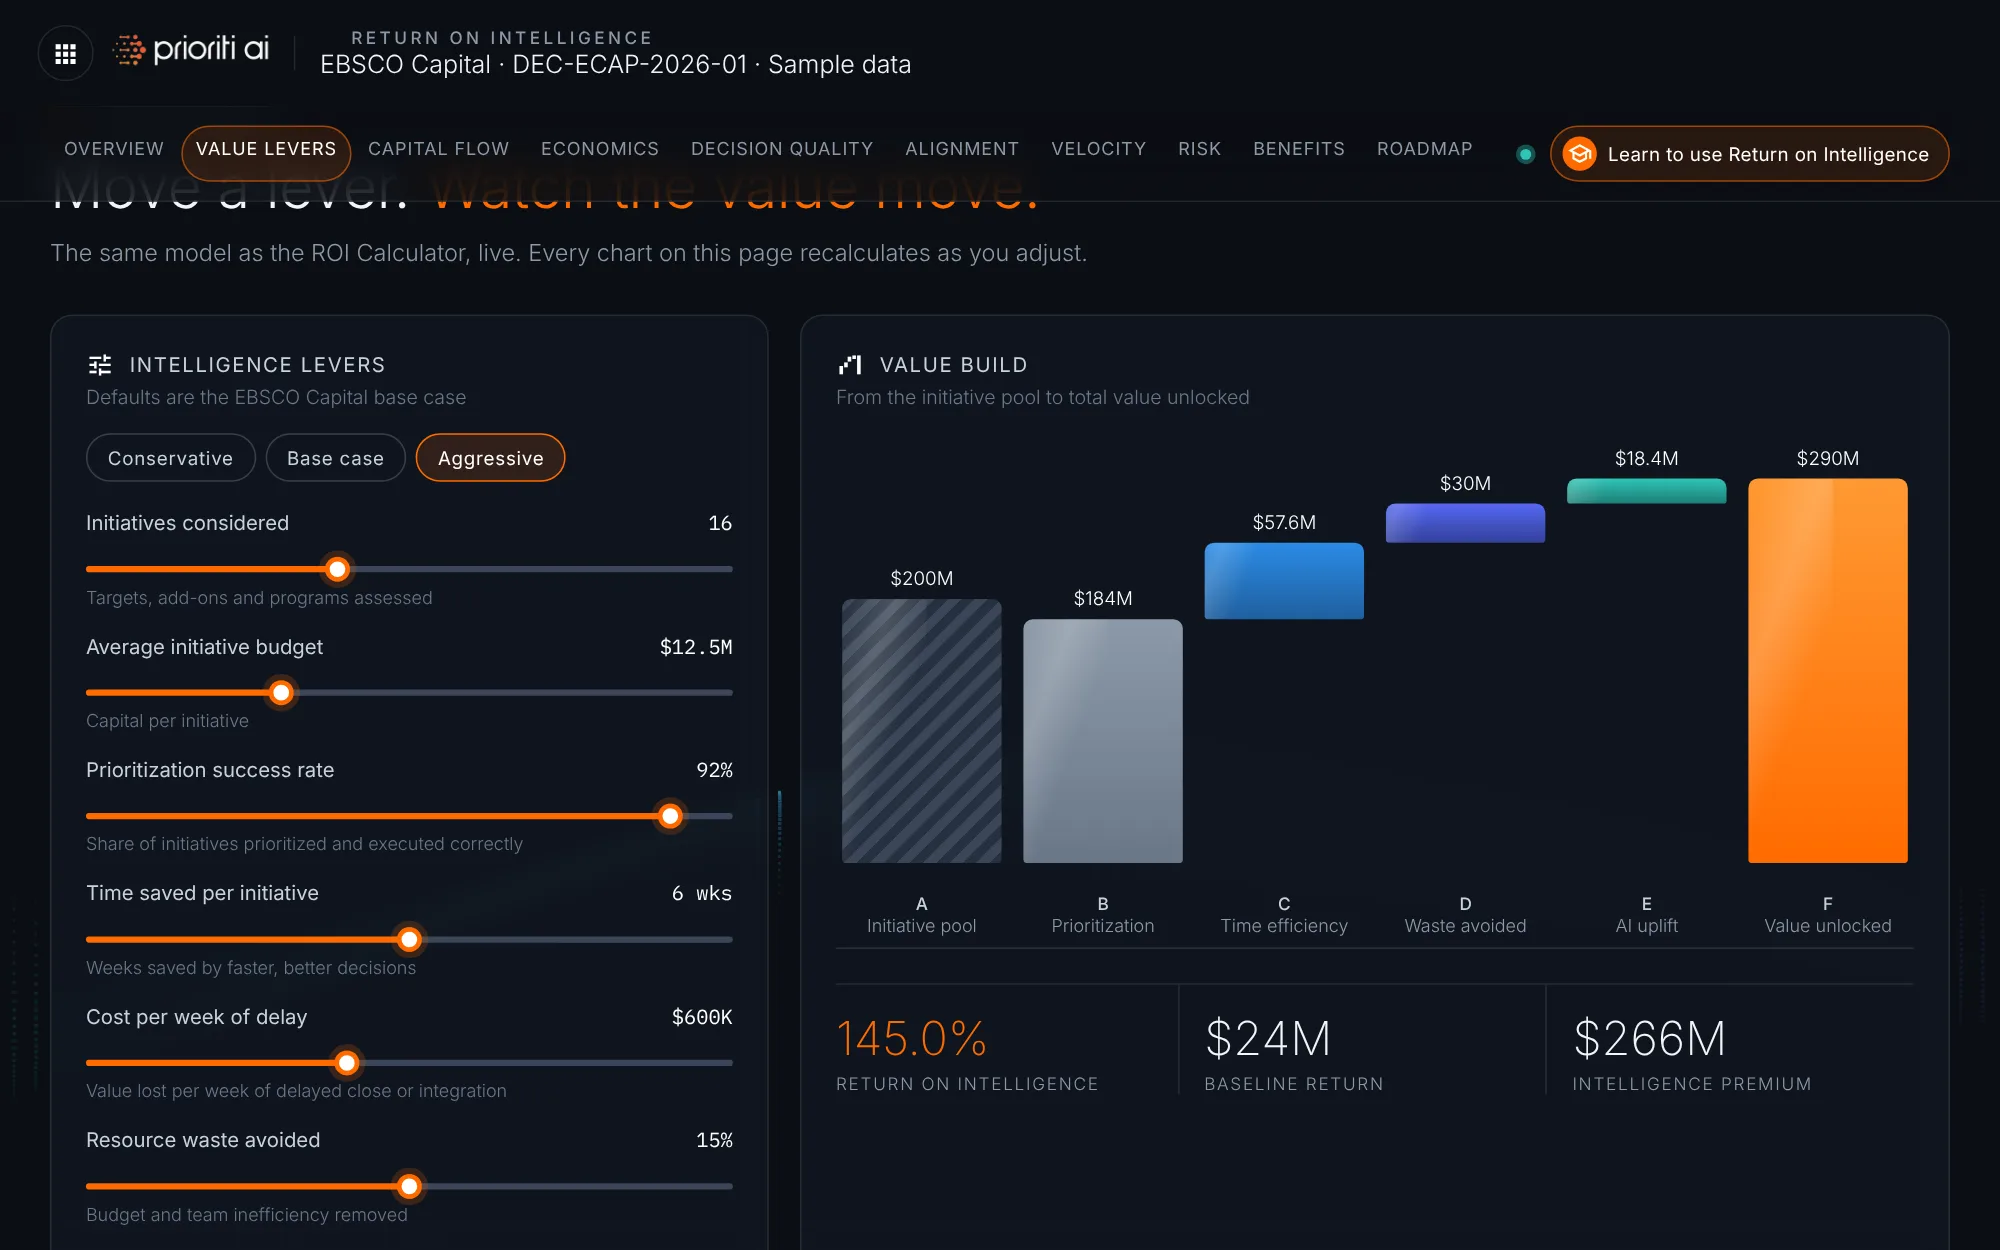
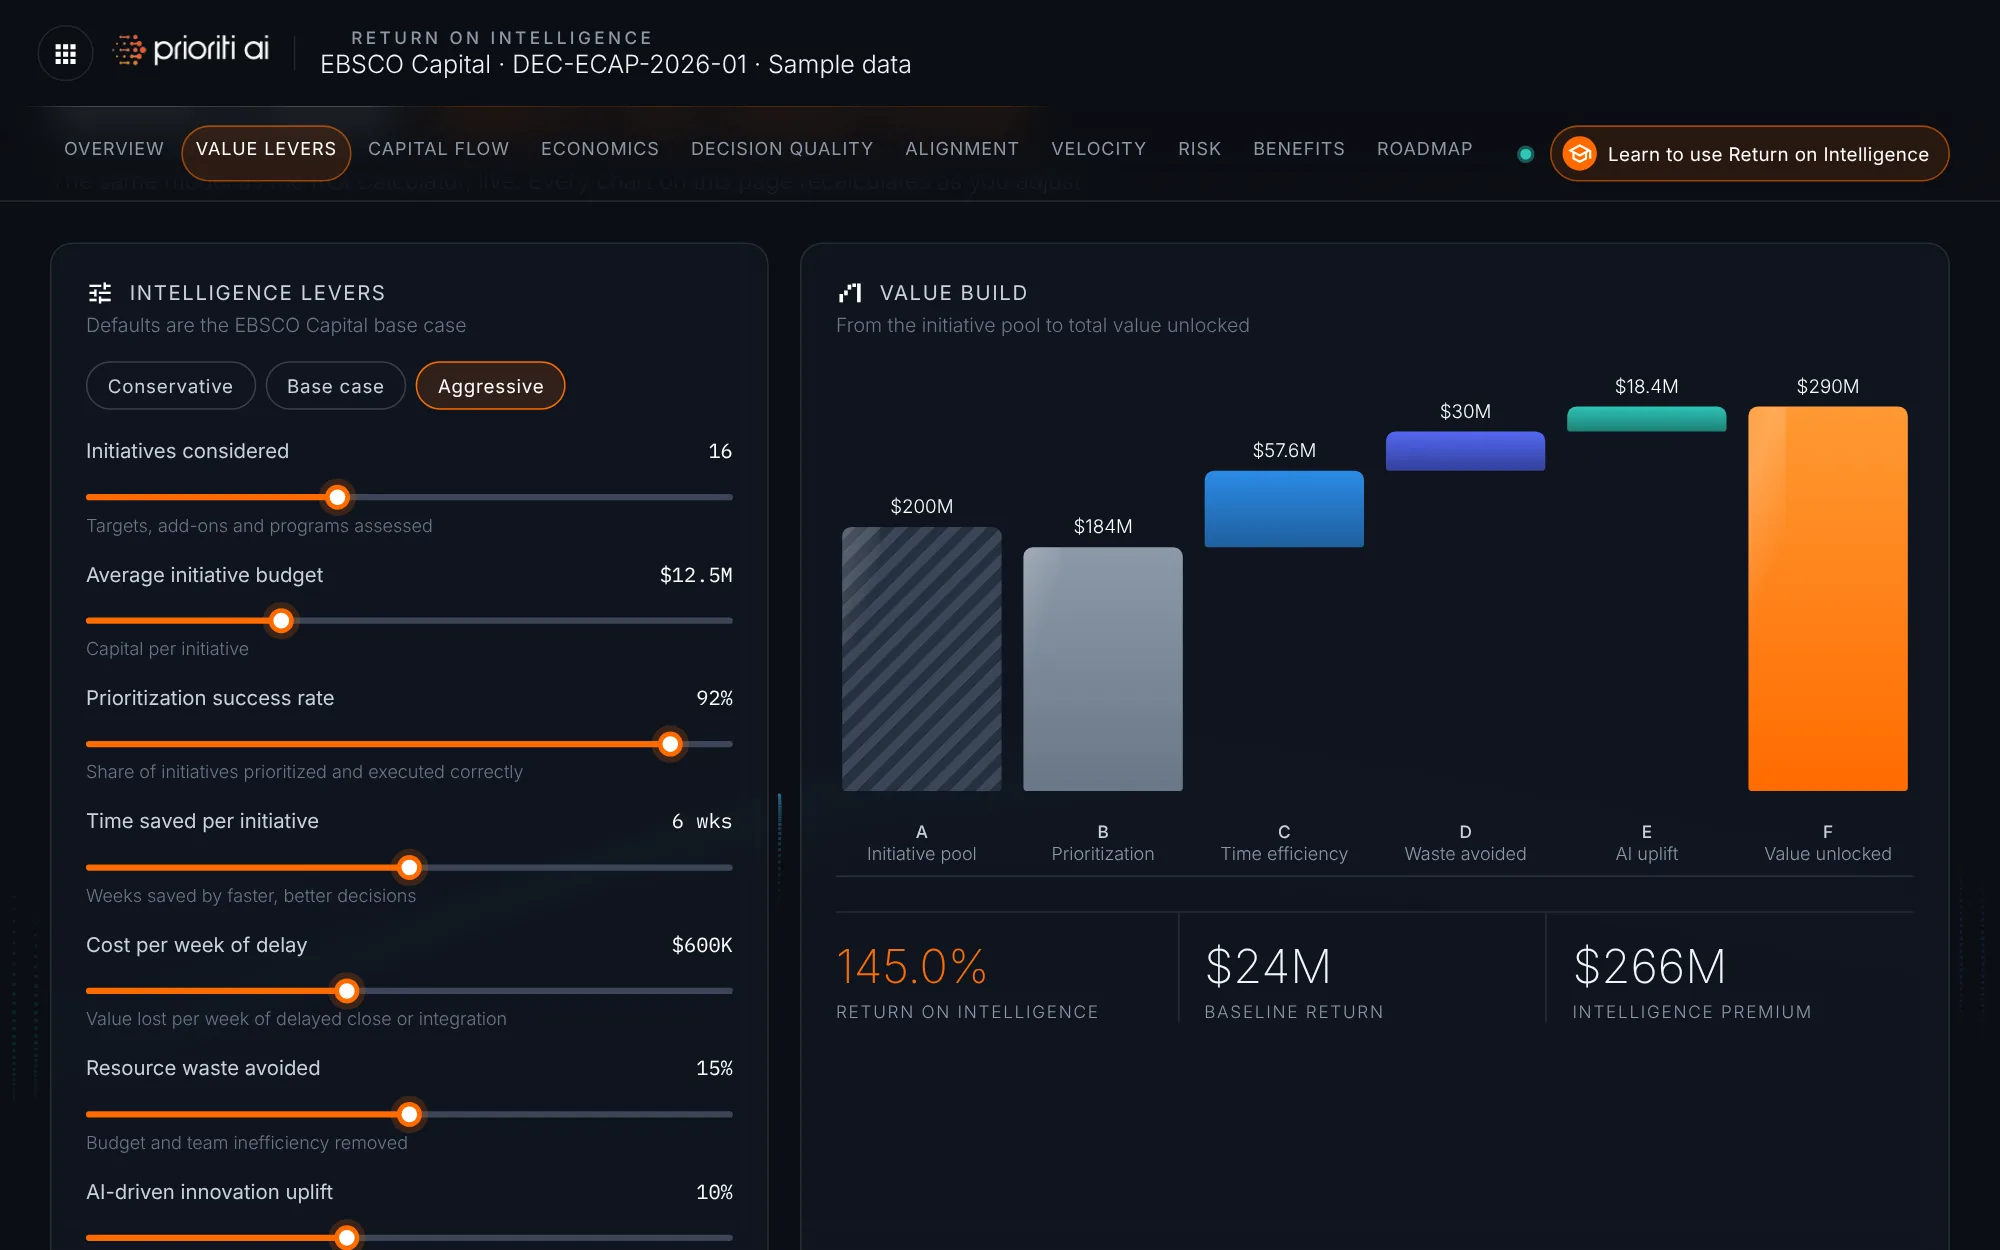
Choose a preset to test a scenario. Aggressive raises the success rate, time saved, and waste avoided.
The waterfall rebuilds live, from the initiative pool through each driver to total value unlocked.
Below it, the return on intelligence, the baseline return, and the intelligence premium update with every change.
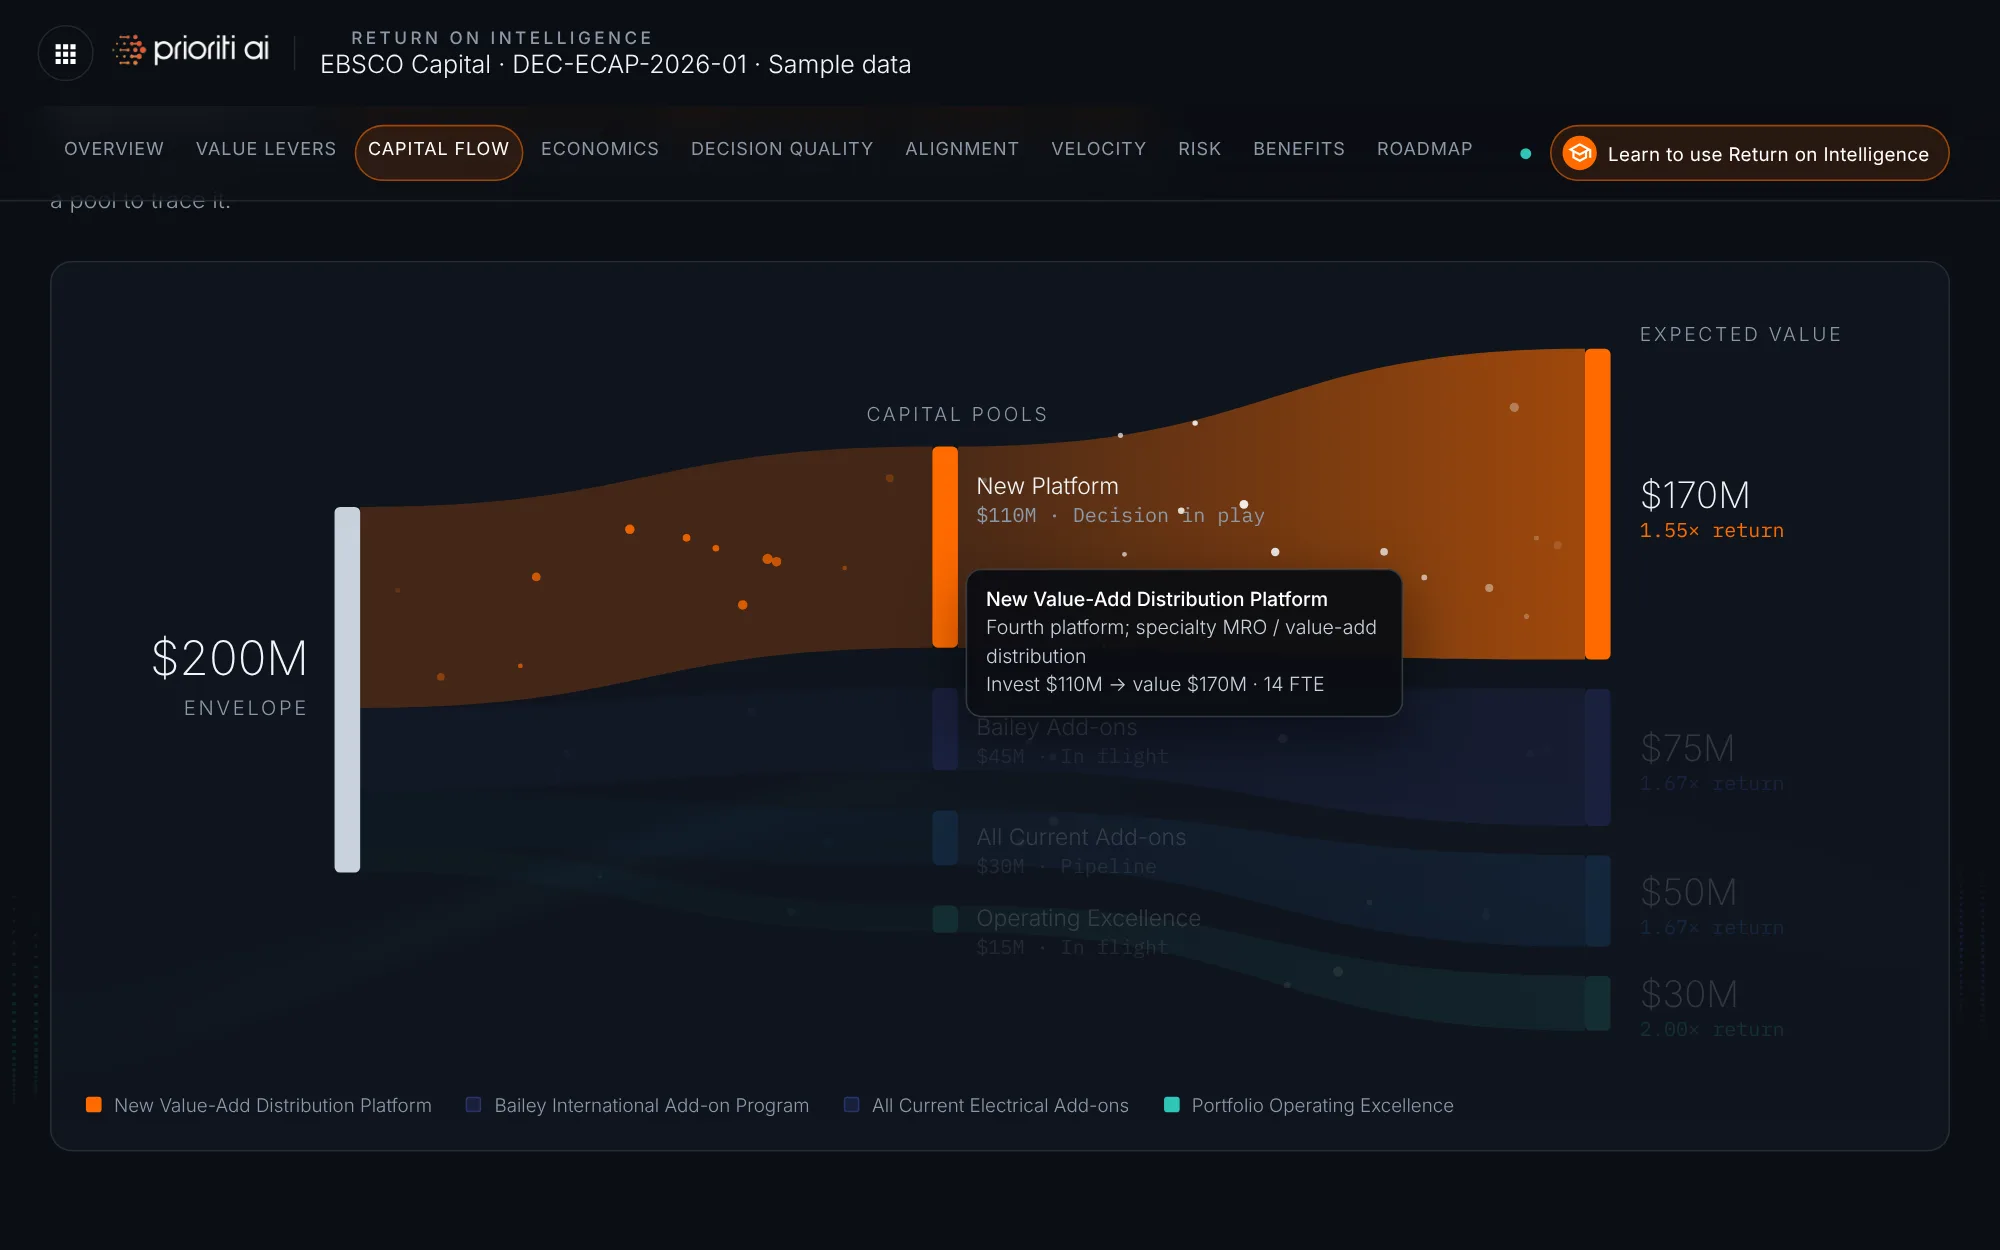
Capital flows from the $200 million envelope to four pools. Each band widens by the value it returns. Hover a pool to trace it.
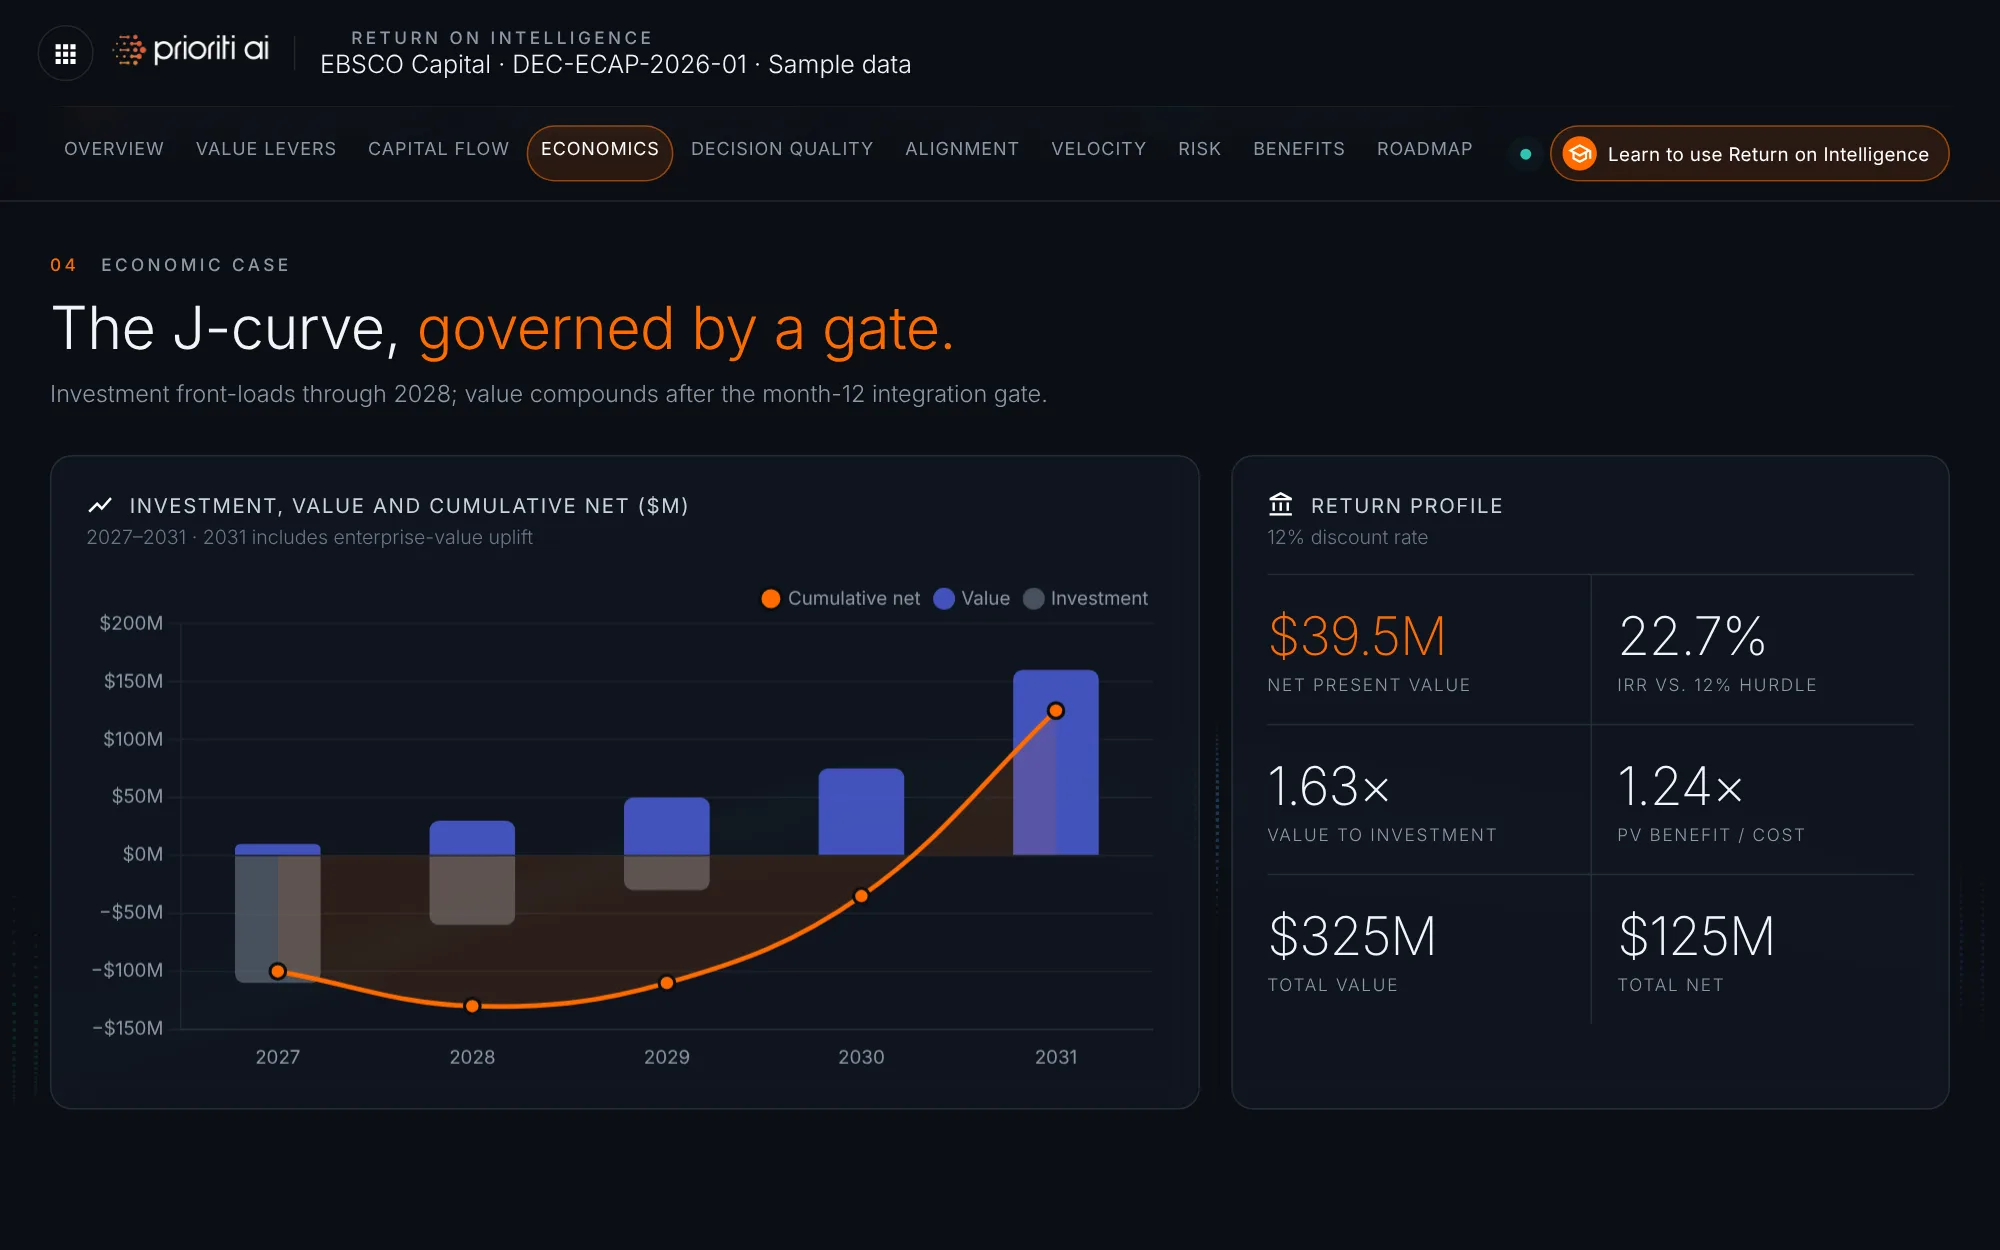
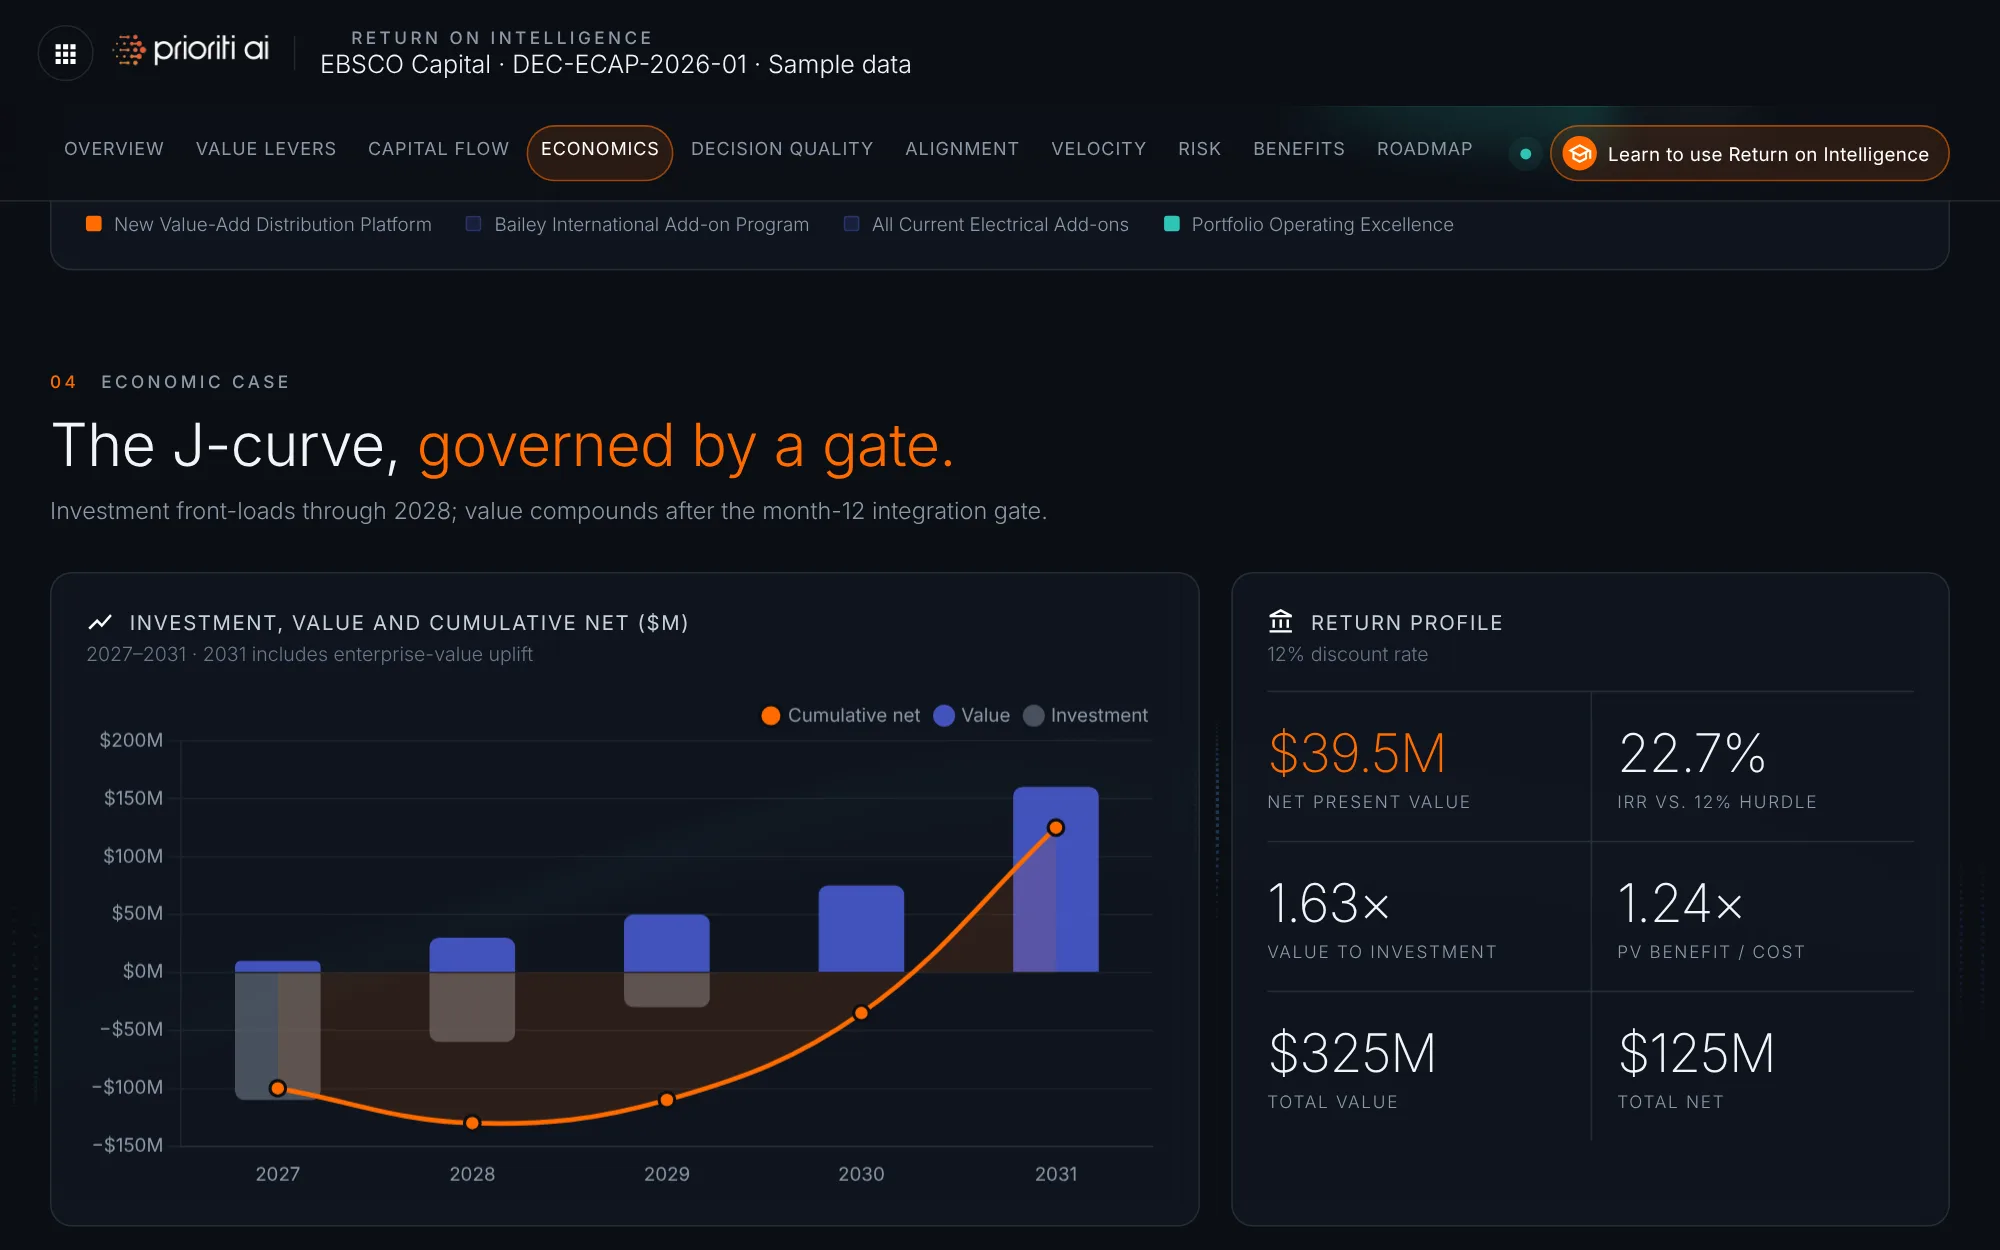
The J-curve shows investment front-loaded through 2028, with value compounding after the month-12 gate.
The return profile sums it up: $39.5 million NPV, a 22.7% IRR, and 1.63 times value on investment.
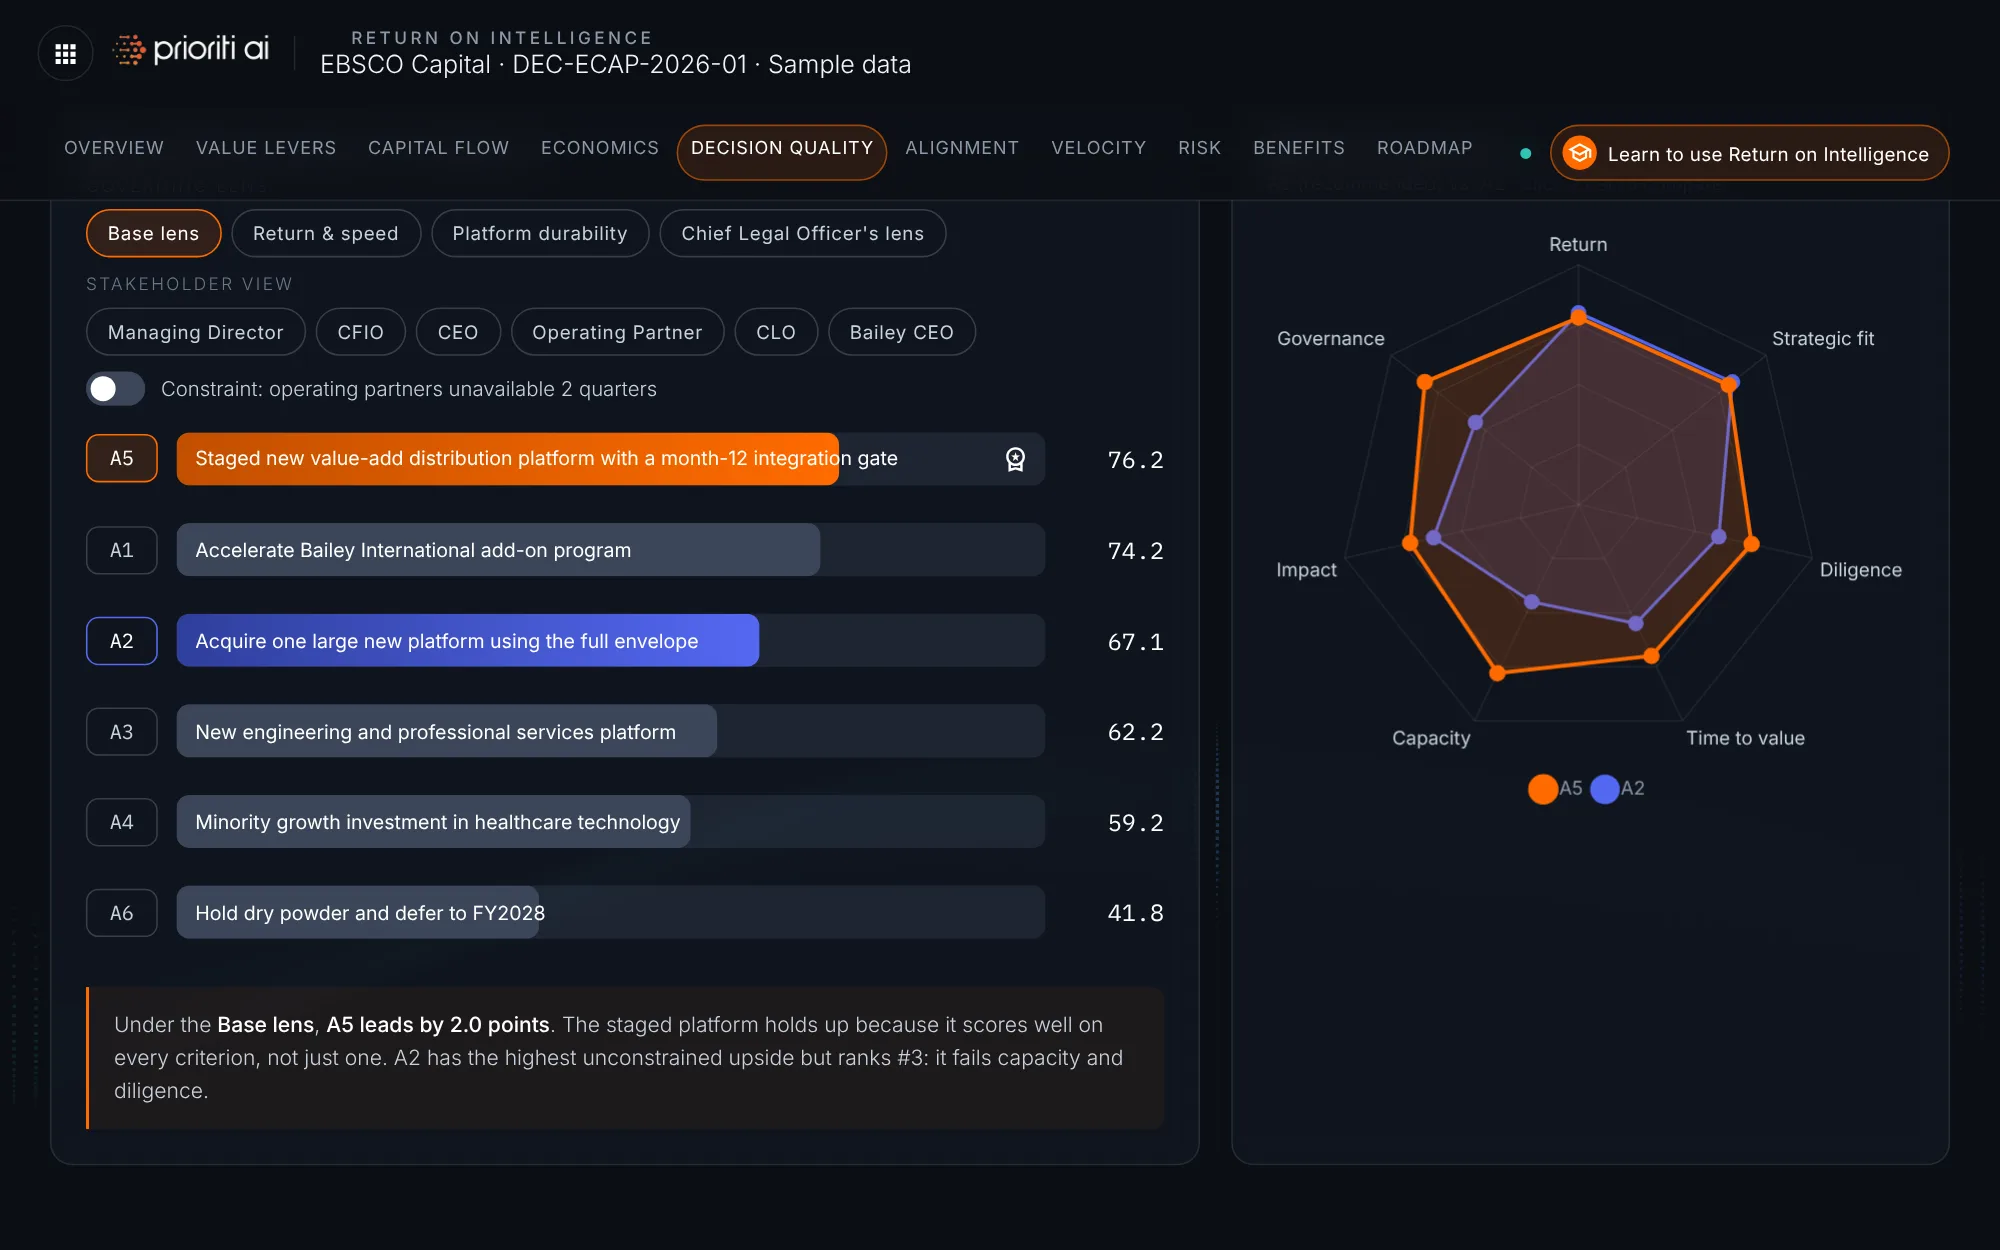
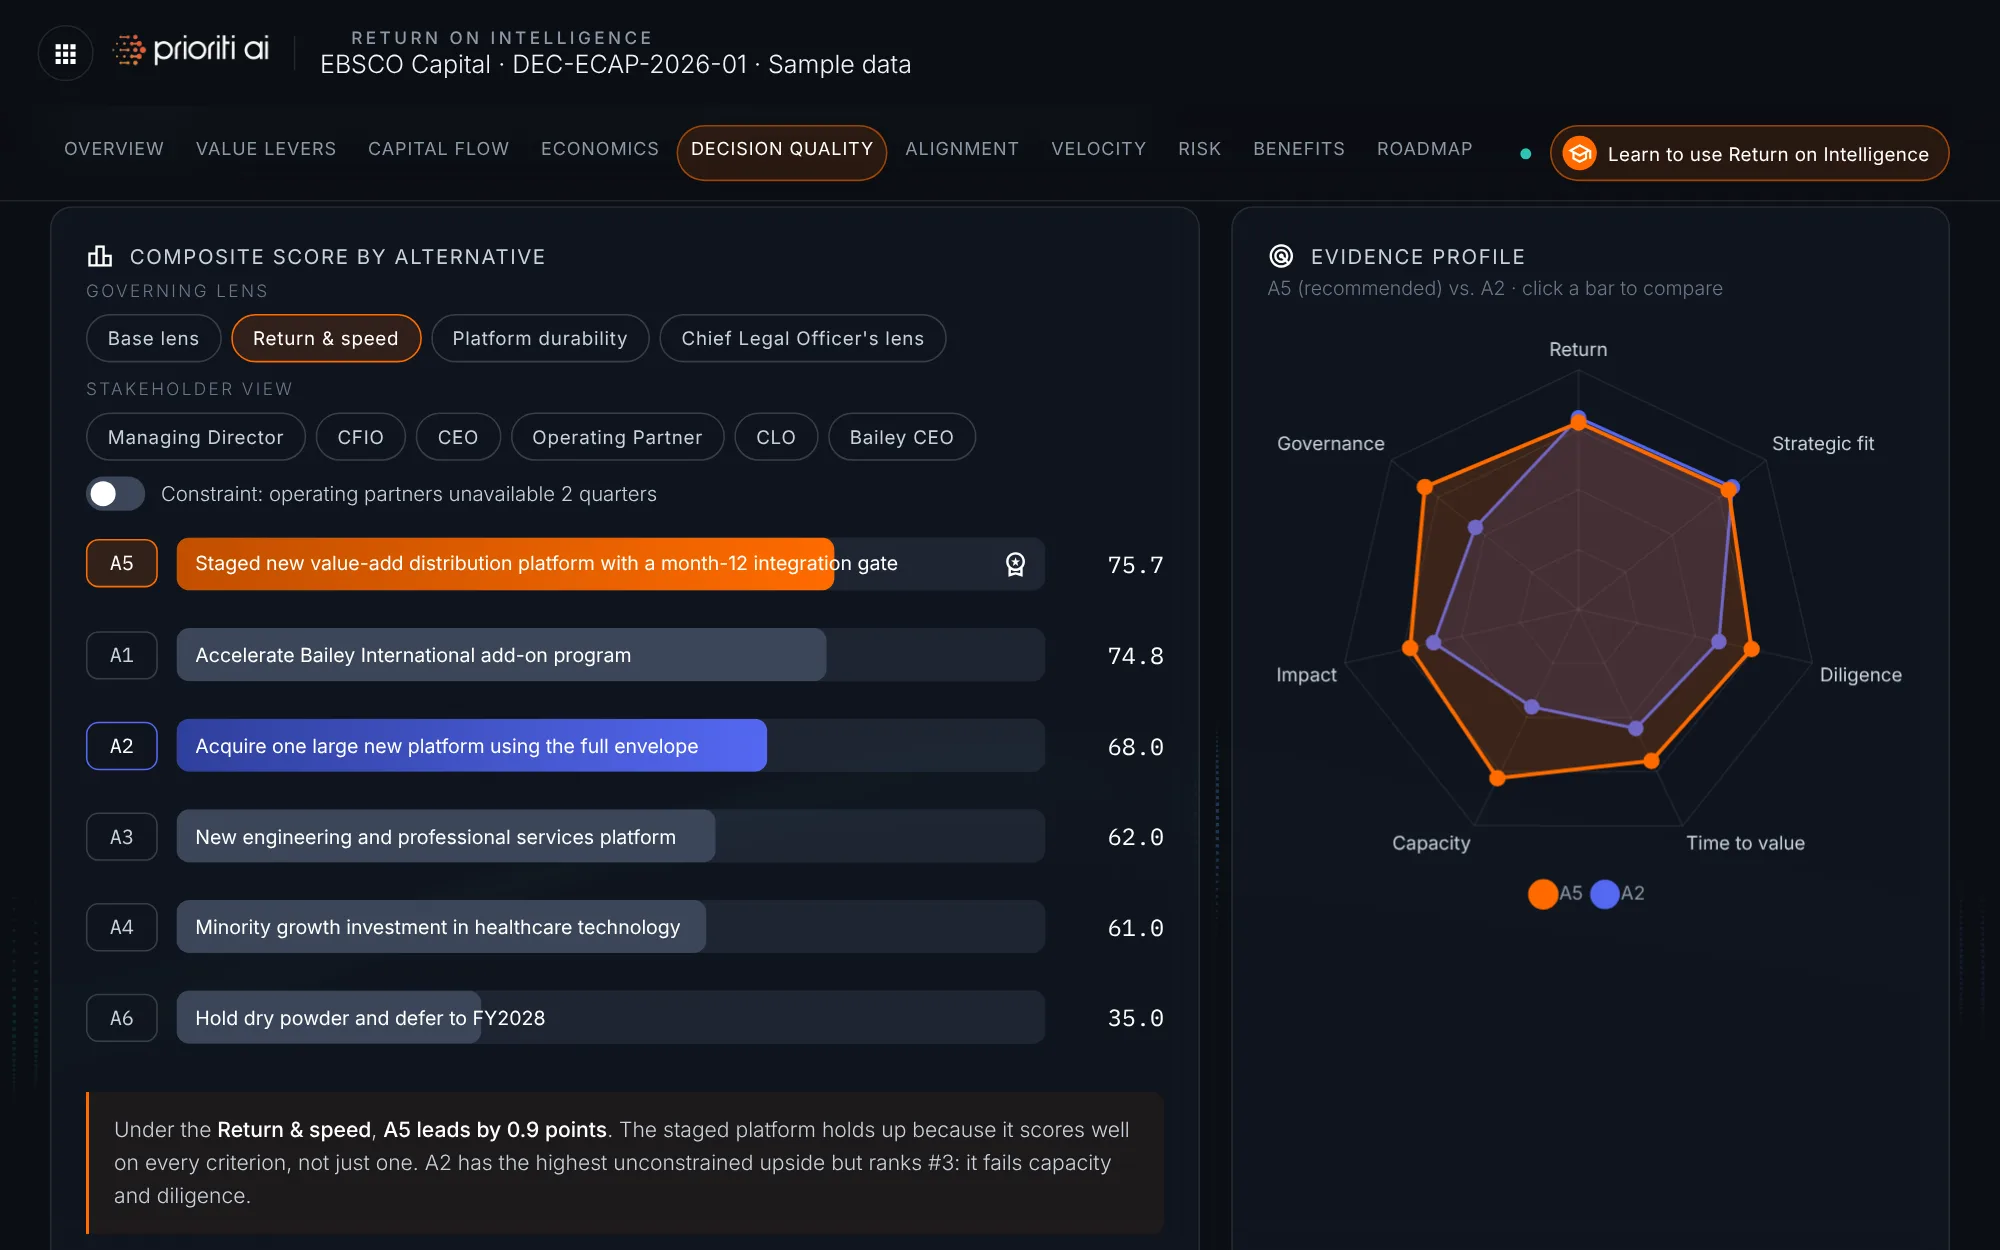
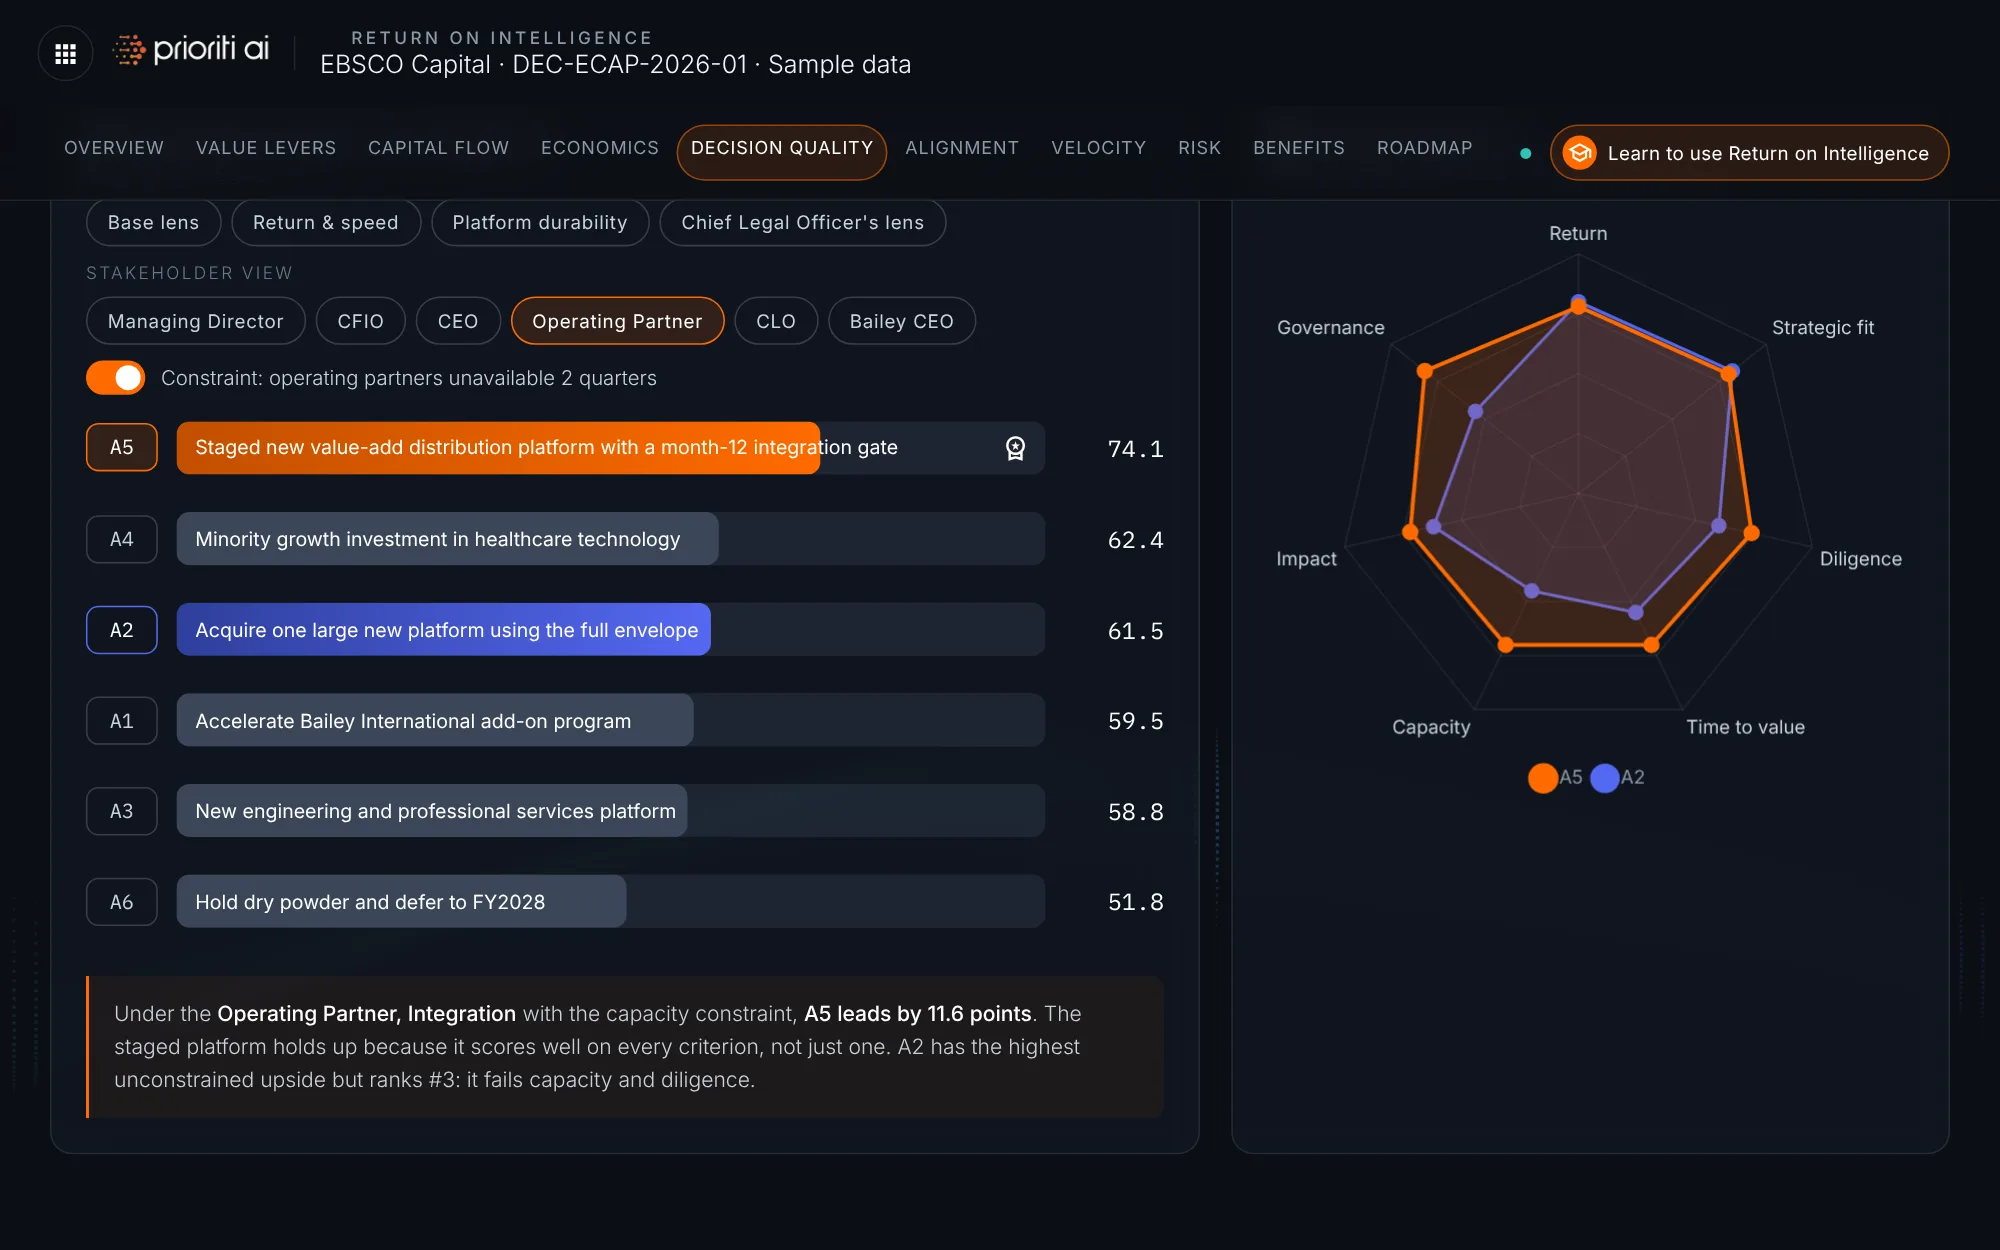
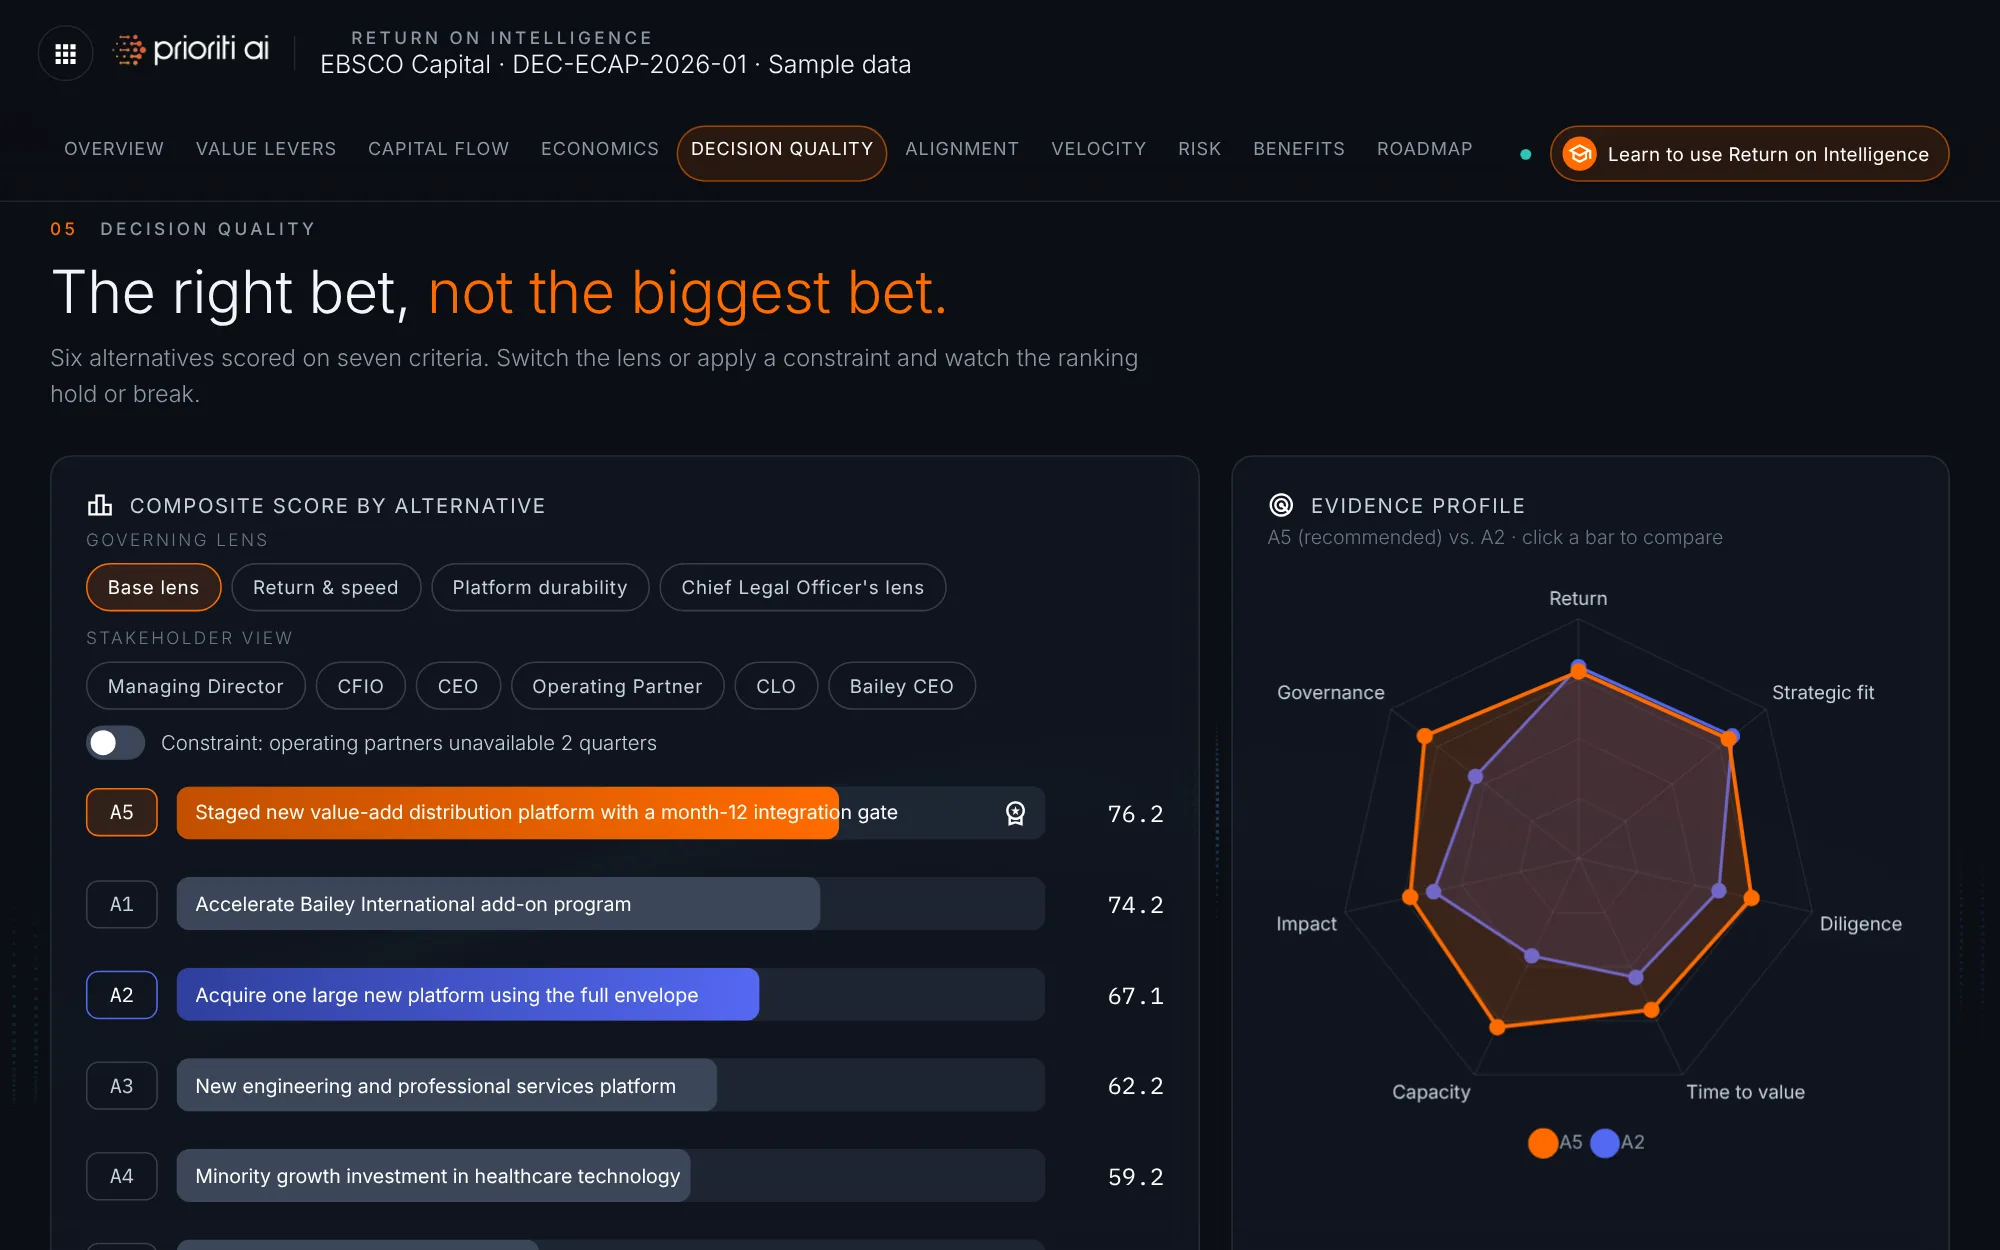
Six alternatives are scored on seven criteria. A5, the staged platform, leads at 76.2.
Switch the lens and the bars re-rank. Each lens asks a different question of the same evidence.
Pick a stakeholder or apply the capacity constraint. The insight below explains whether A5 still leads, and why.
The radar compares A5 with any alternative. Click a bar to swap. A2 has more upside, but weaker evidence.
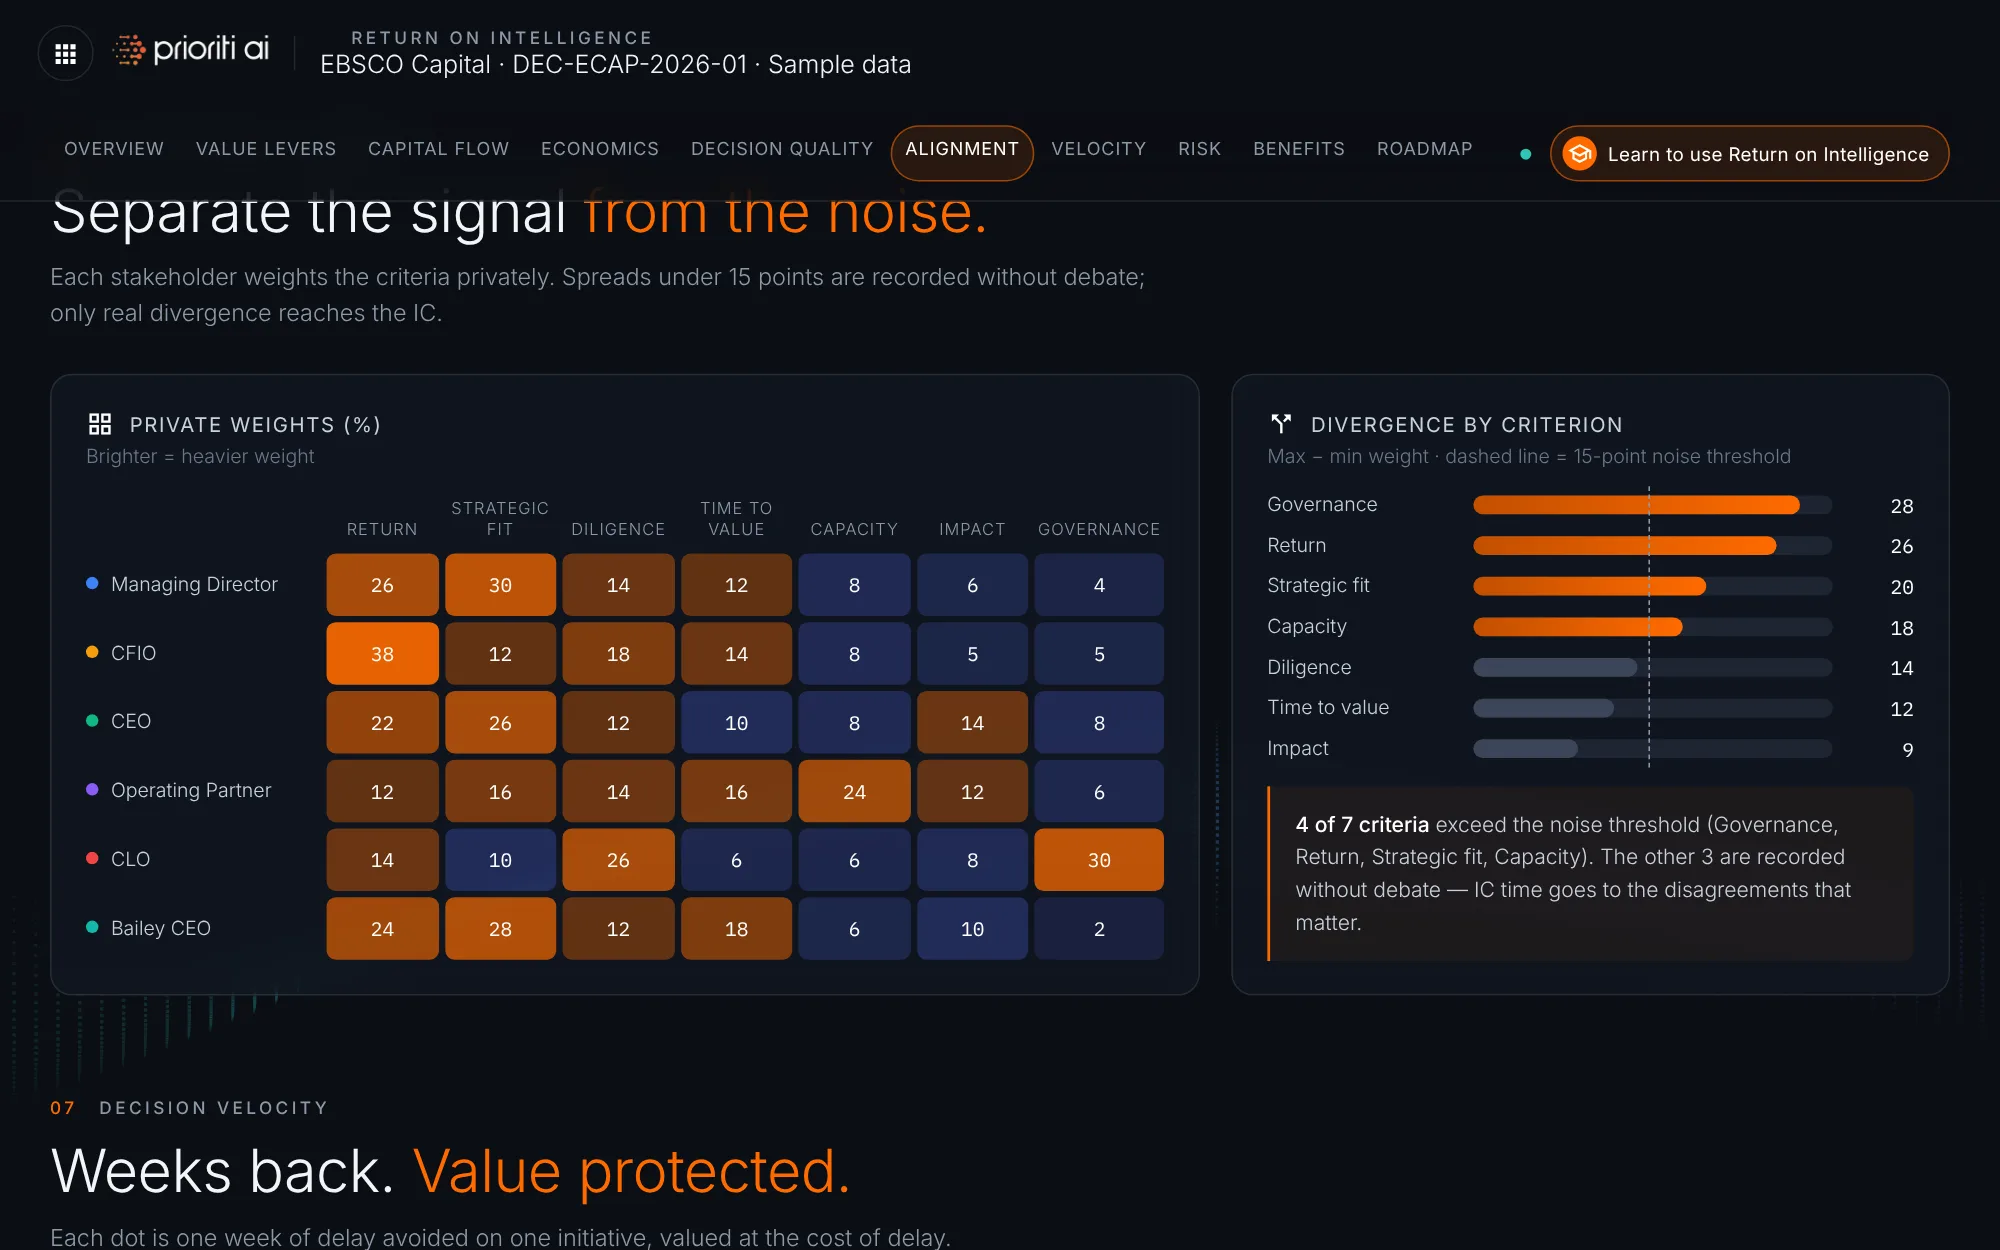
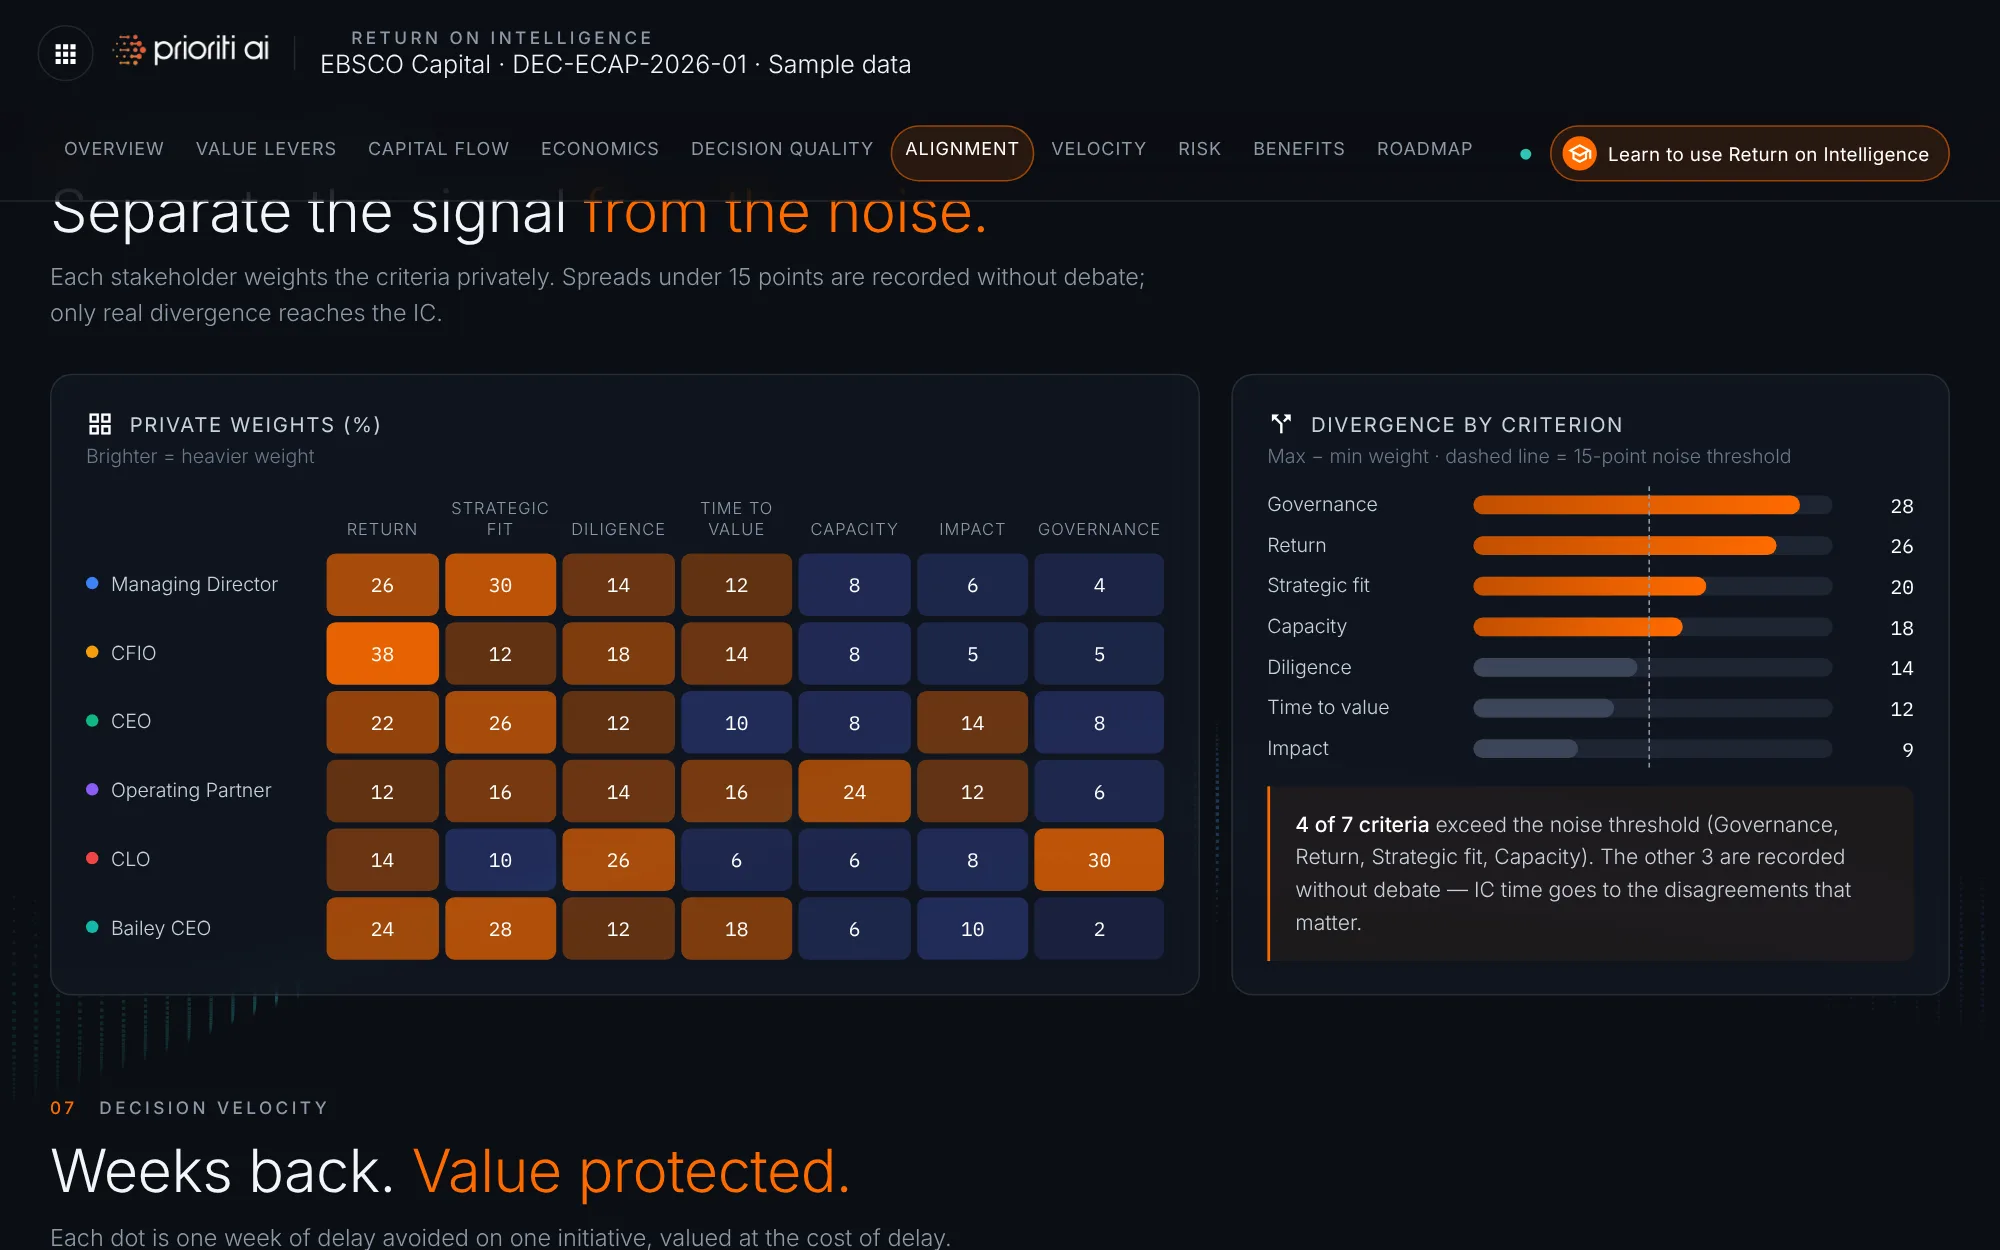
The heat grid shows how each stakeholder weights the criteria, privately, before anyone sees the result.
Four of seven criteria exceed the 15-point noise threshold. Only those reach the Investment Committee.
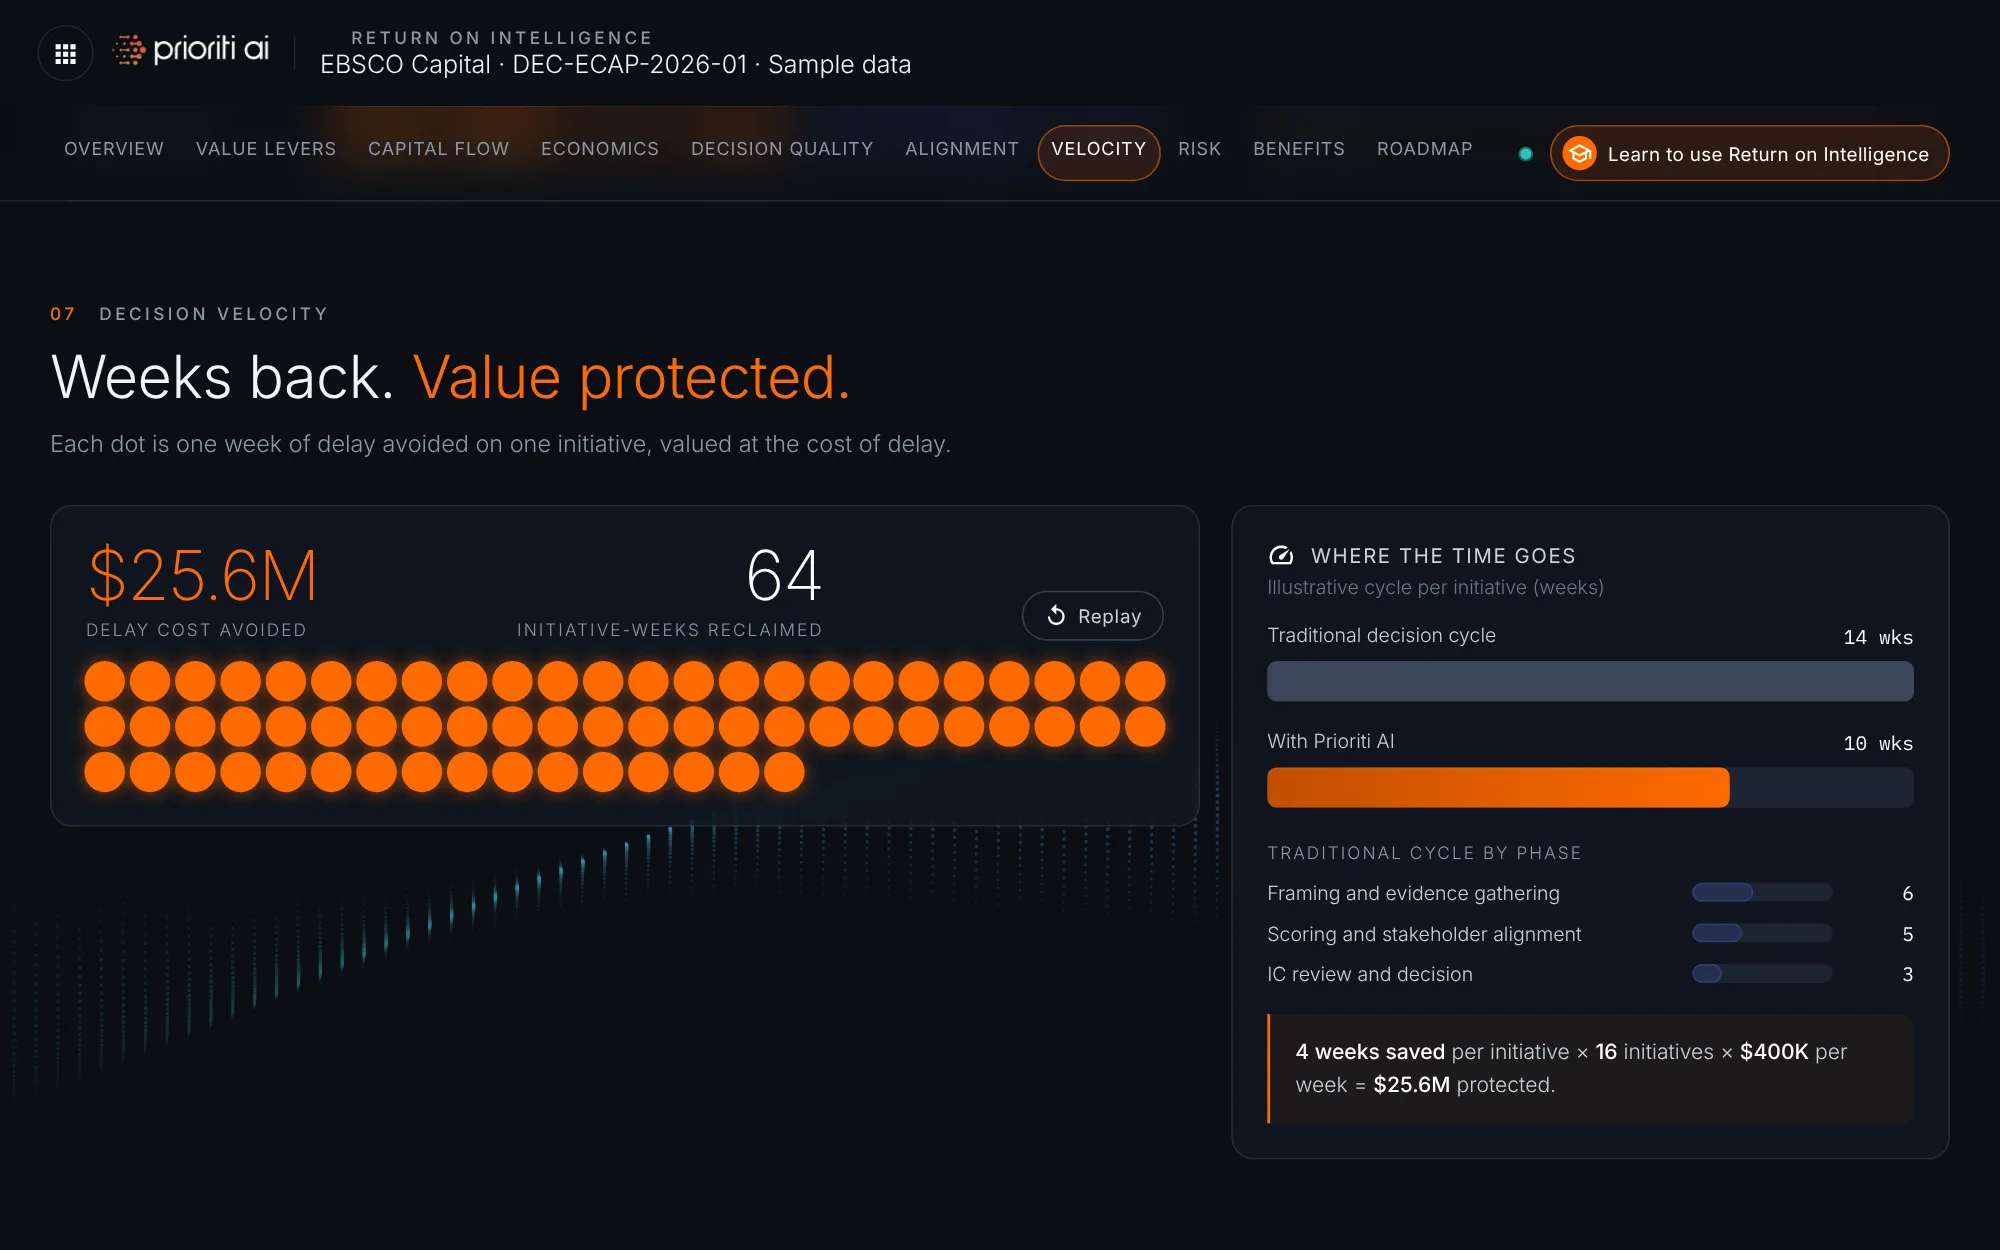
Each dot is one initiative-week of delay avoided. Sixty-four weeks reclaimed protect $25.6 million.
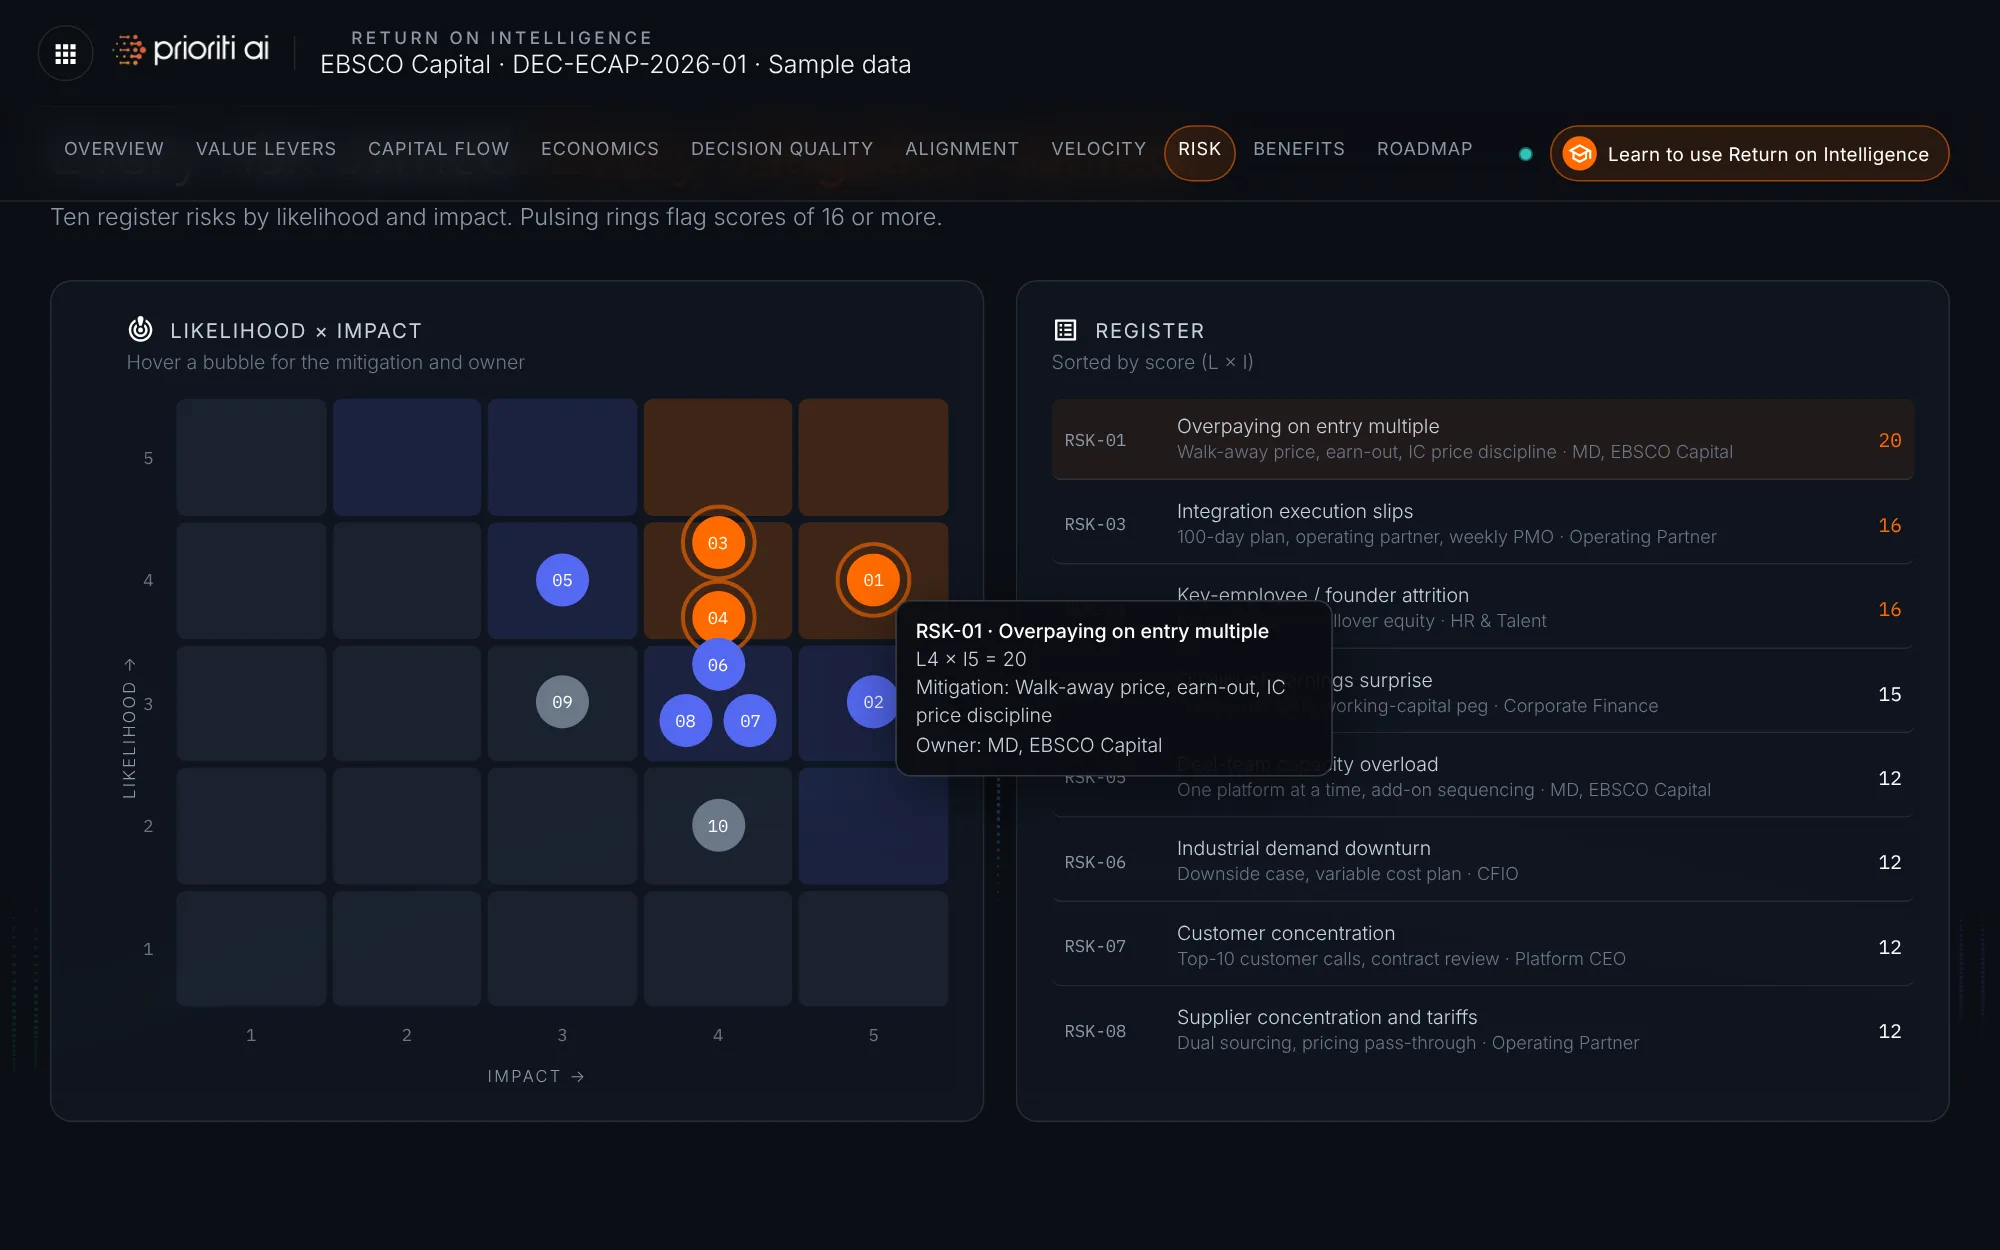
Ten risks sit on a likelihood and impact grid. Pulsing rings flag the highest. Hover any bubble for its mitigation and owner.
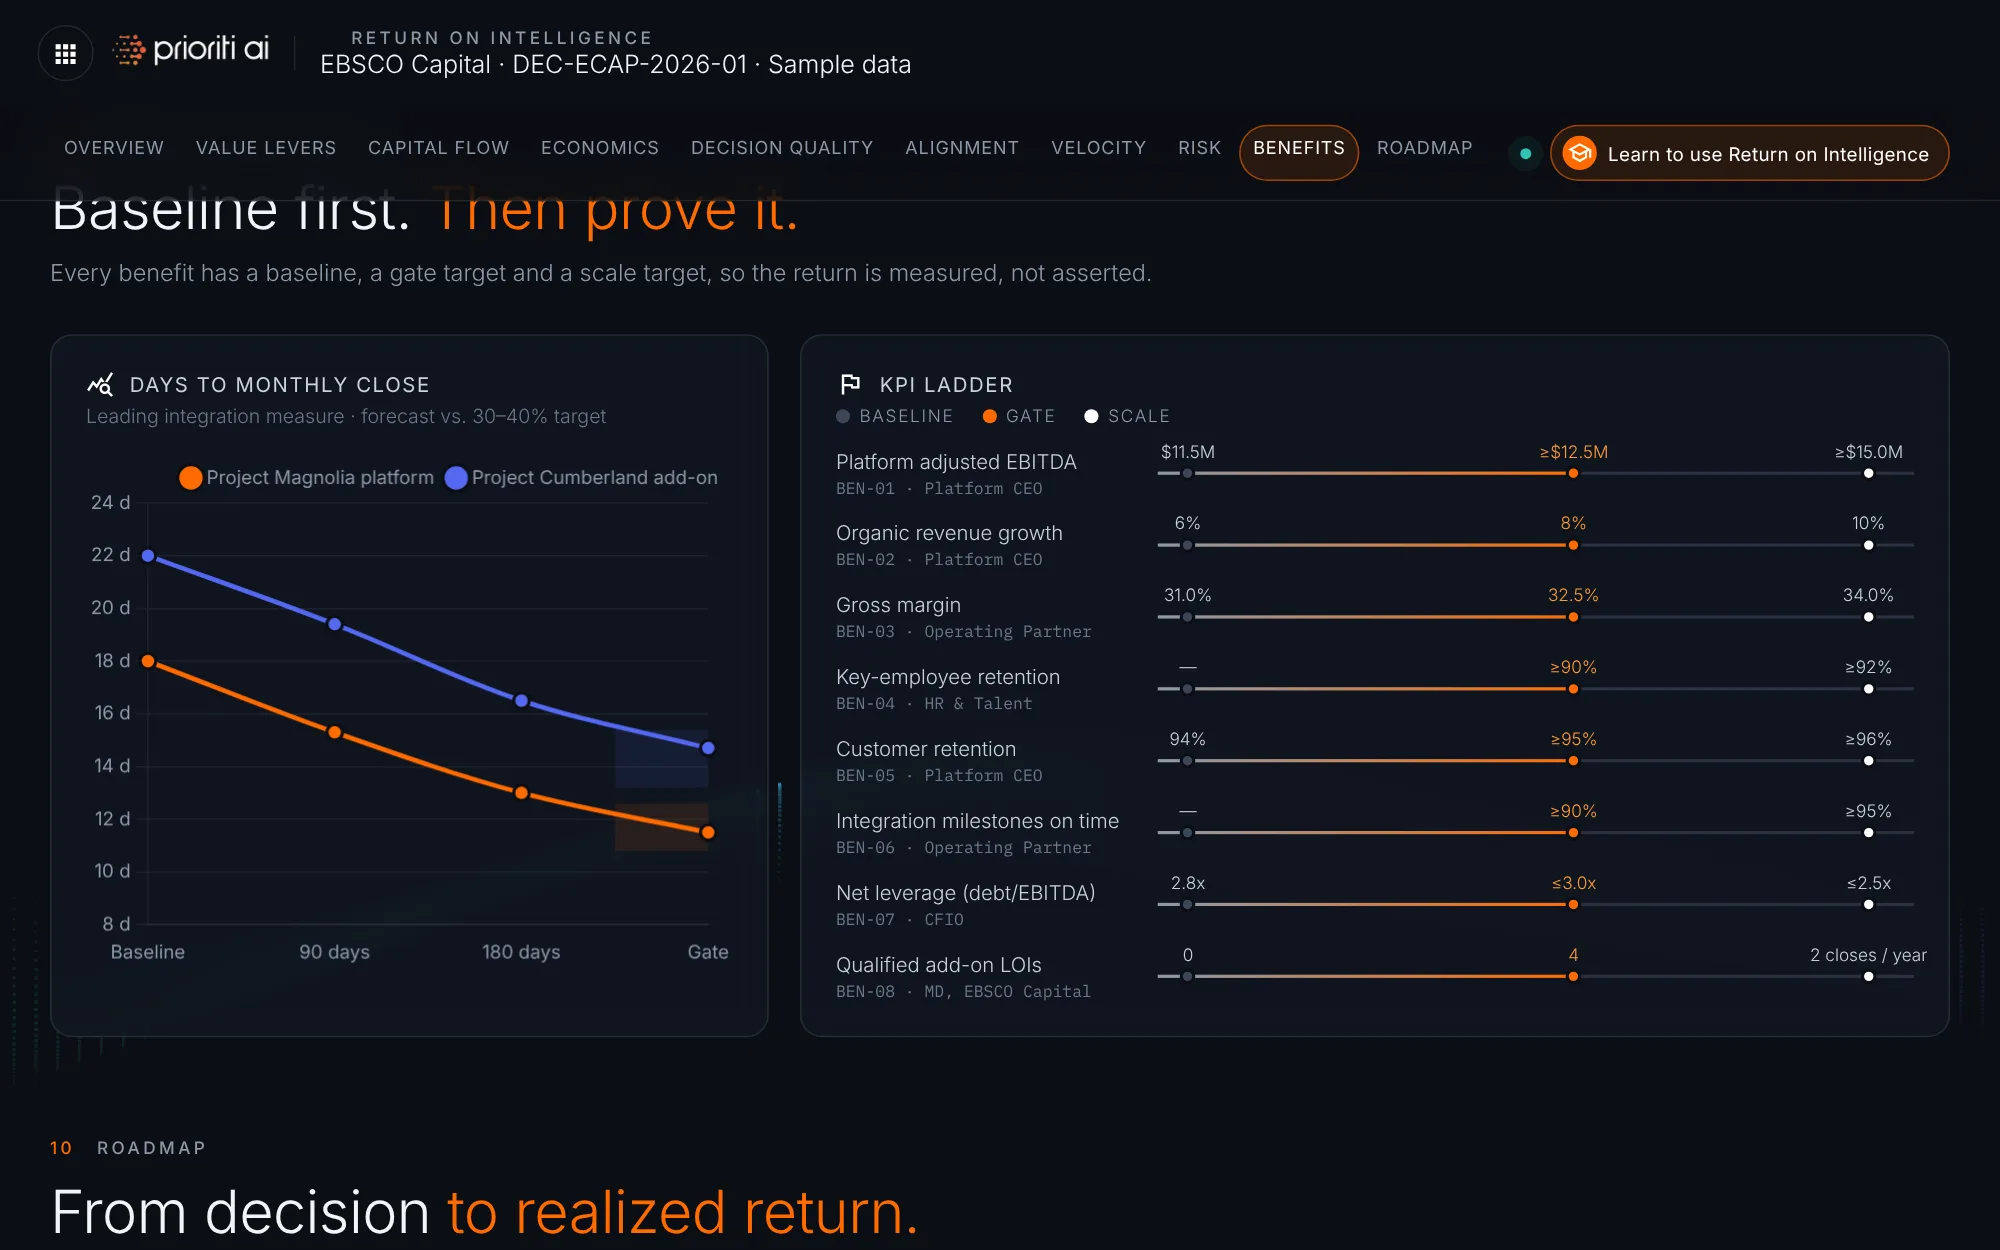
Benefits are measured, not asserted. Days to monthly close track against target, and every KPI has a baseline, gate, and scale target.
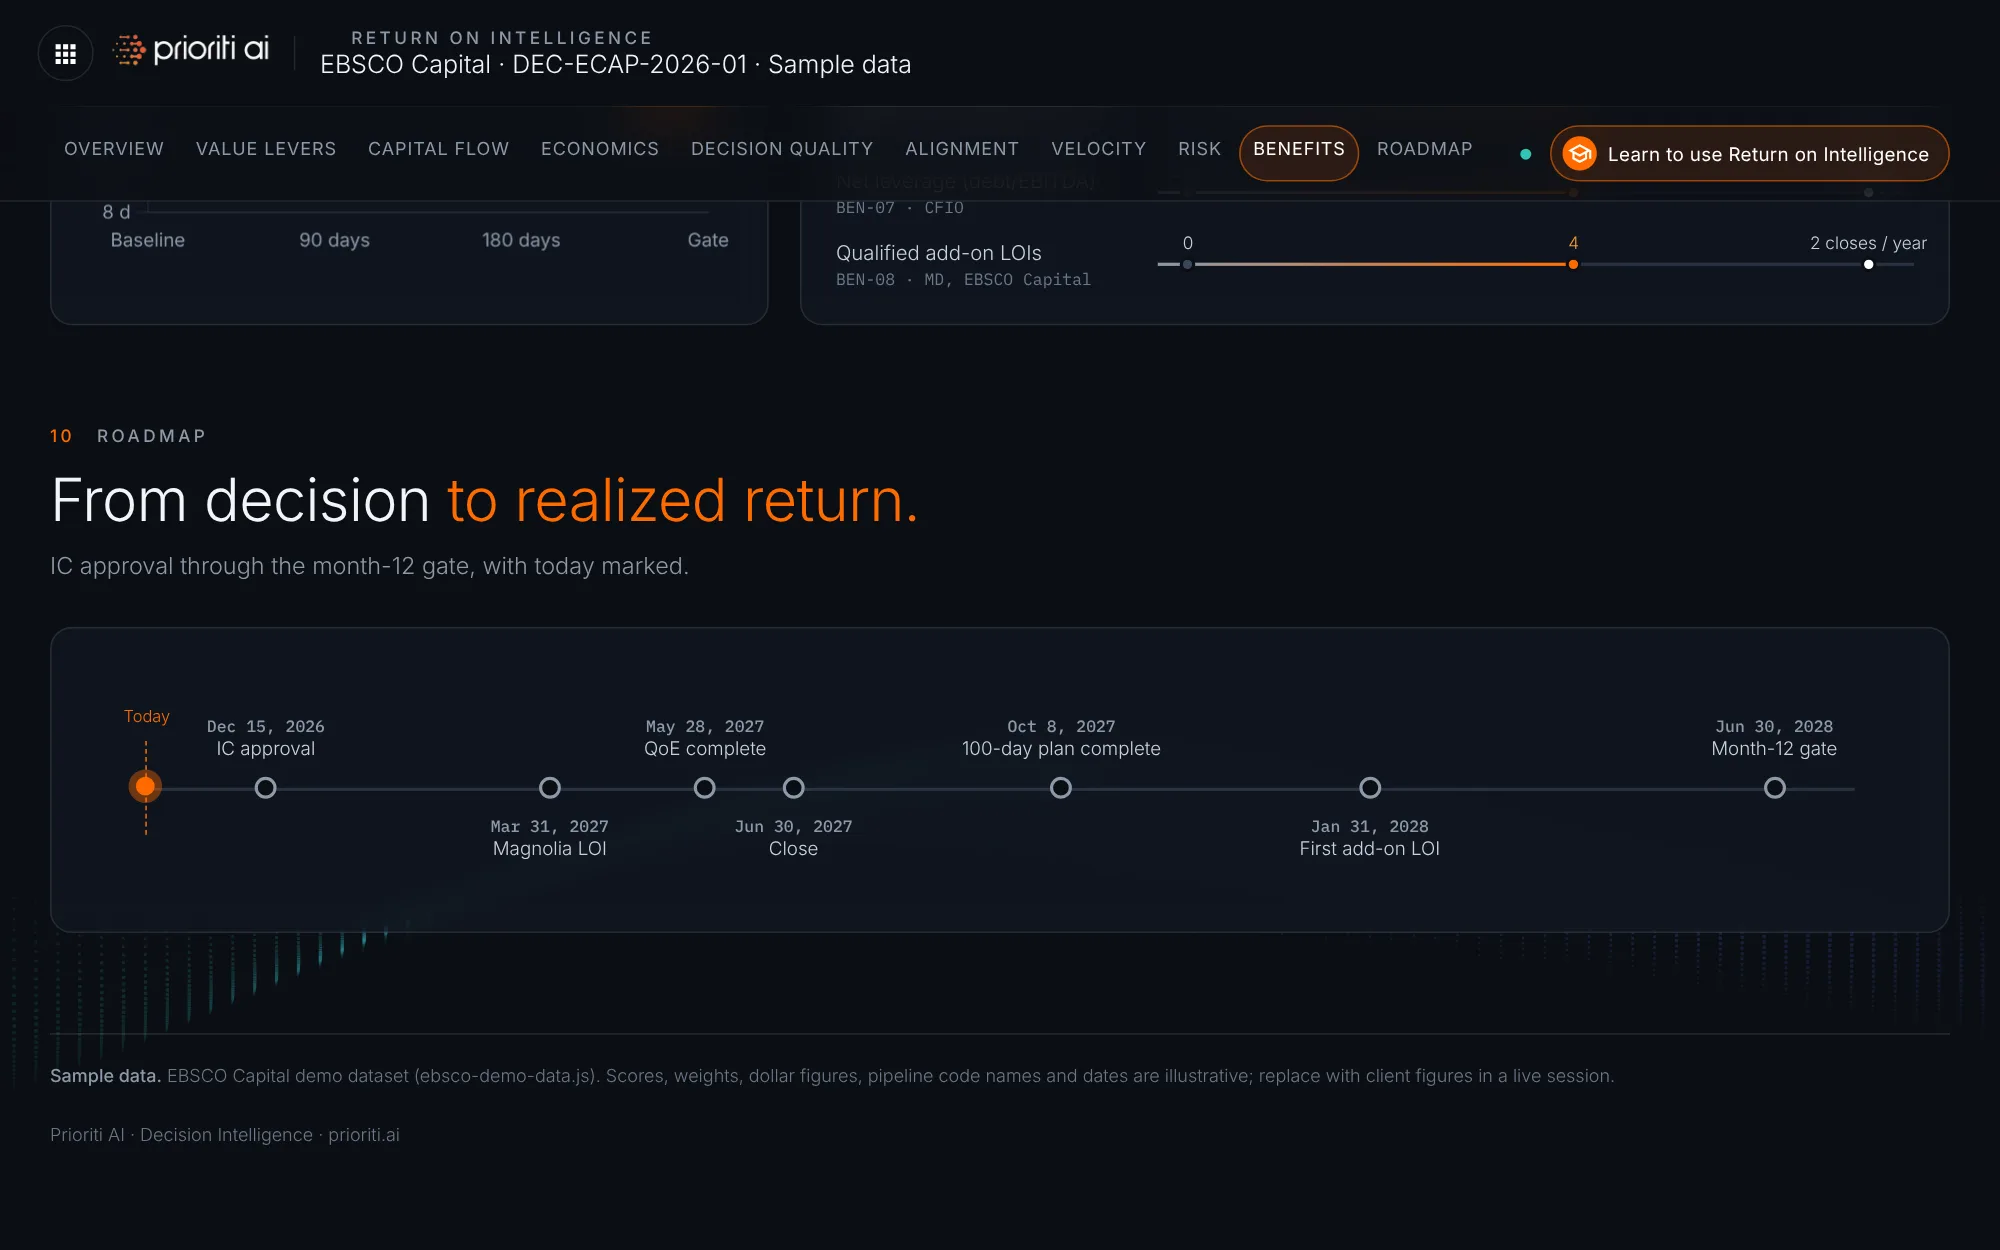
The roadmap runs from IC approval to the month-12 gate, with today marked.
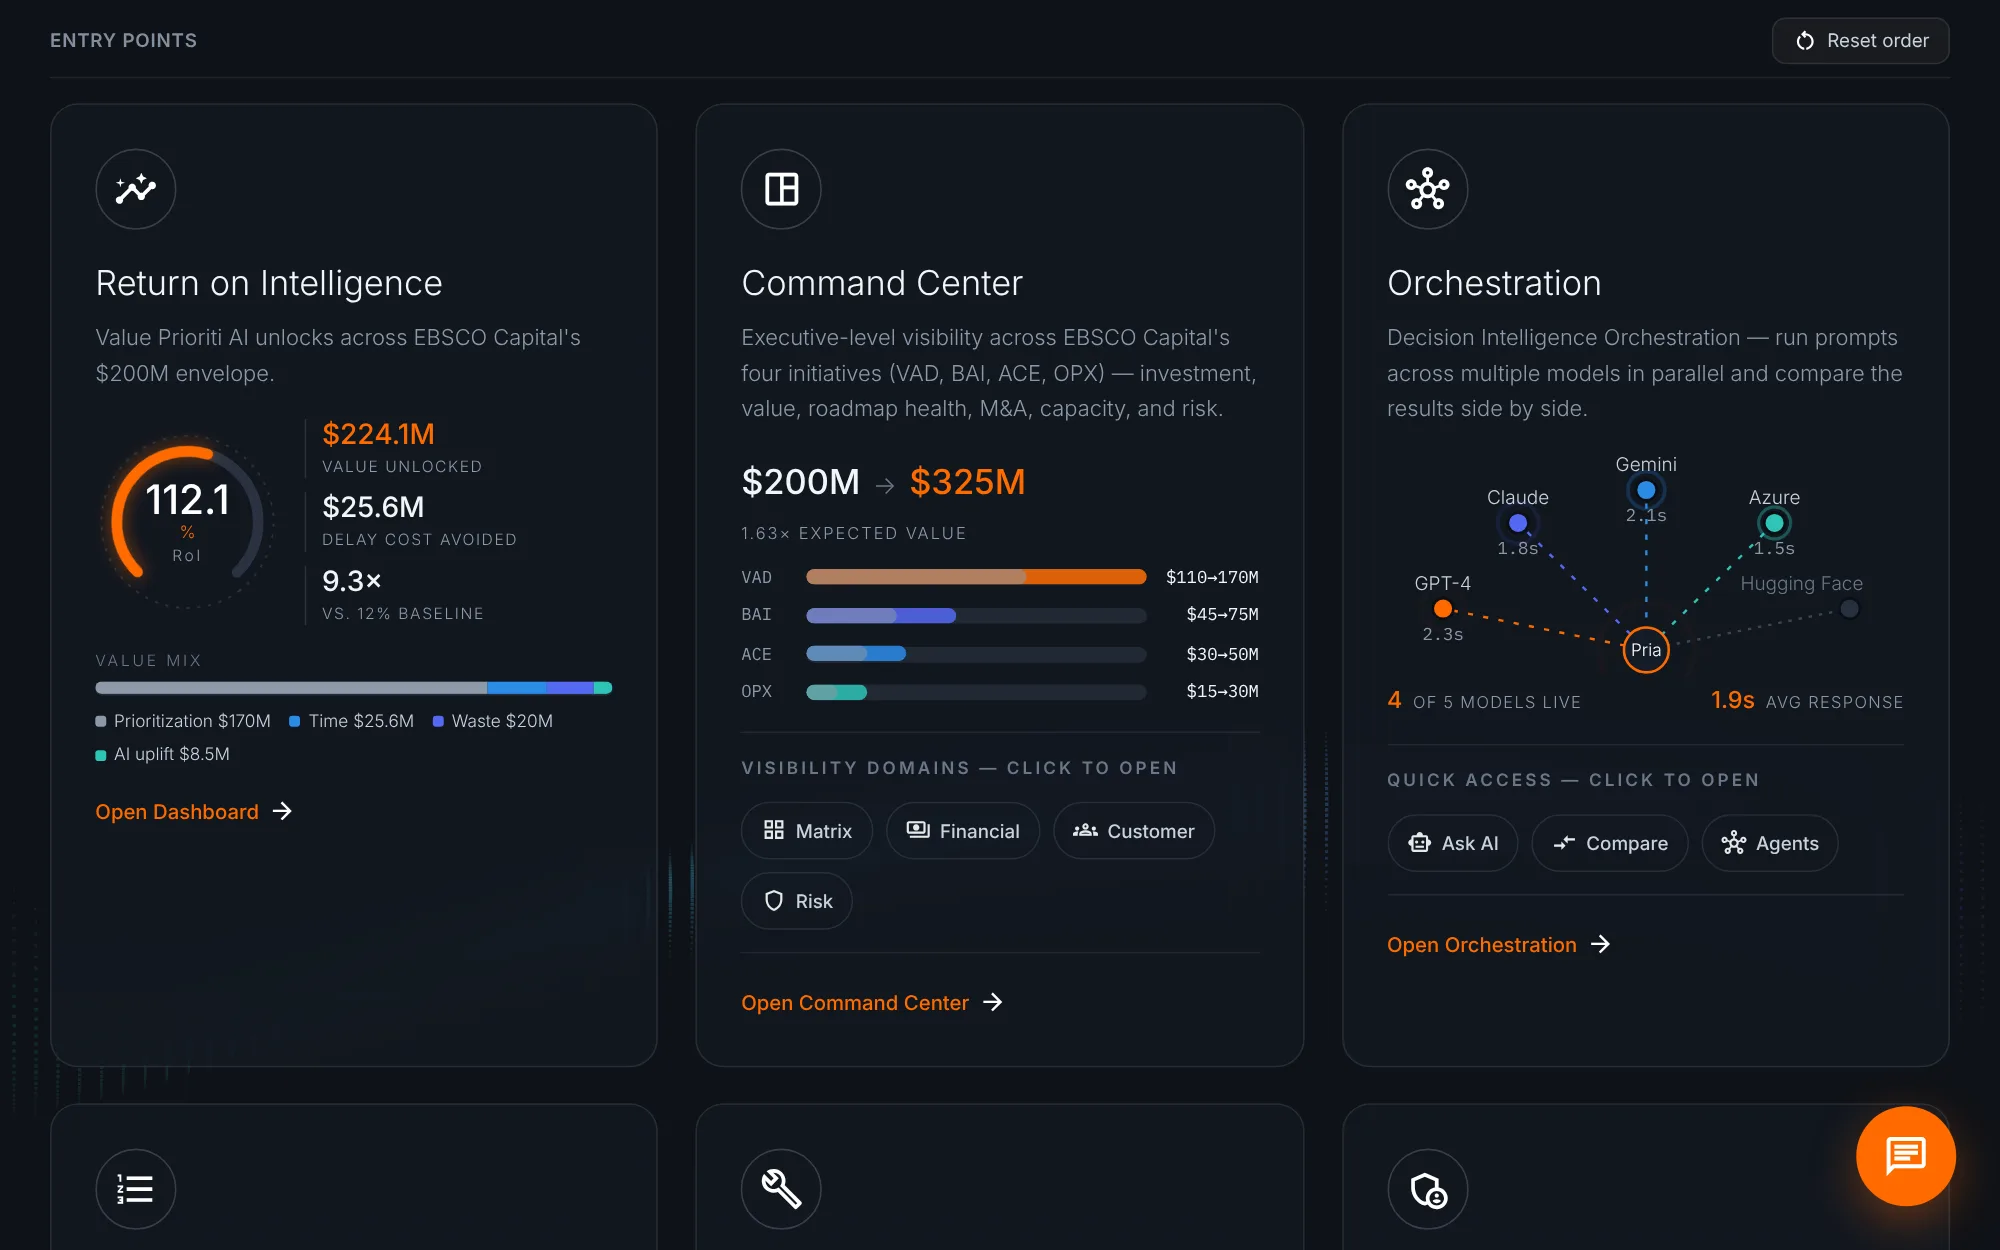
Open this dashboard anytime from the Return on Intelligence card, first on the Workspace. Bring your own numbers and try it.